. 1999 Jul 5;190(1):53-64.
doi: 10.1084/jem.190.1.53.

Anergy and cytokine-mediated suppression as distinct superantigen-induced tolerance mechanisms in vivo

Affiliations

Anergy and cytokine-mediated suppression as distinct superantigen-induced tolerance mechanisms in vivo

C Miller et al. J Exp Med. .

Abstract

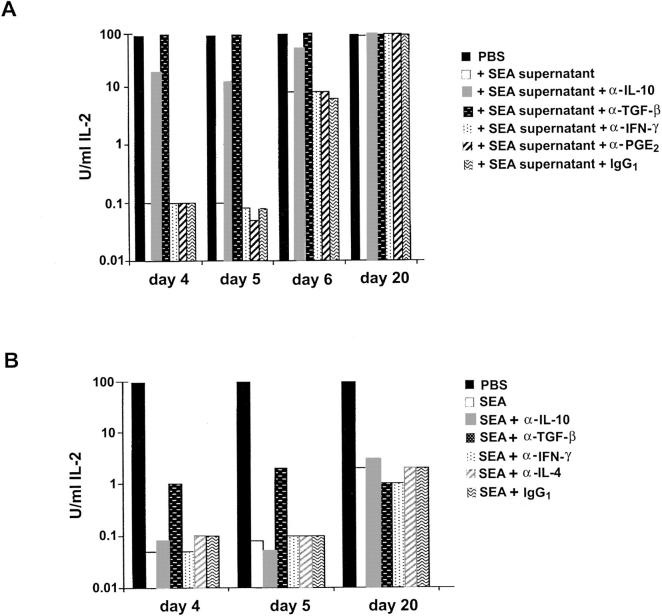
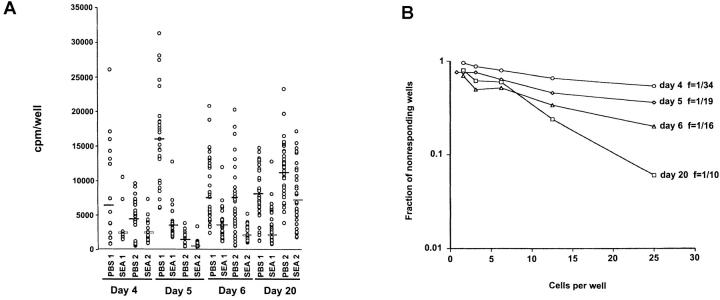
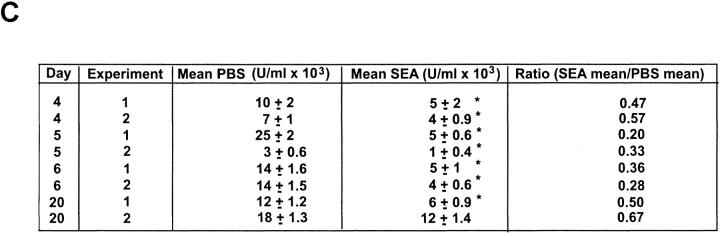
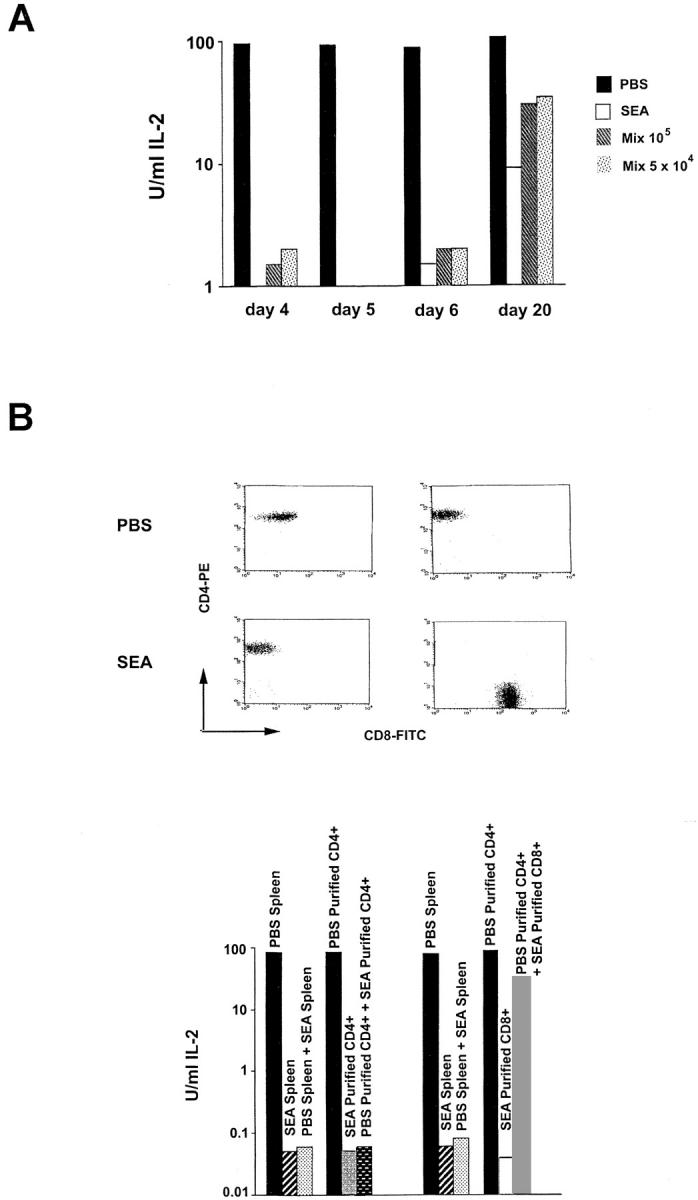
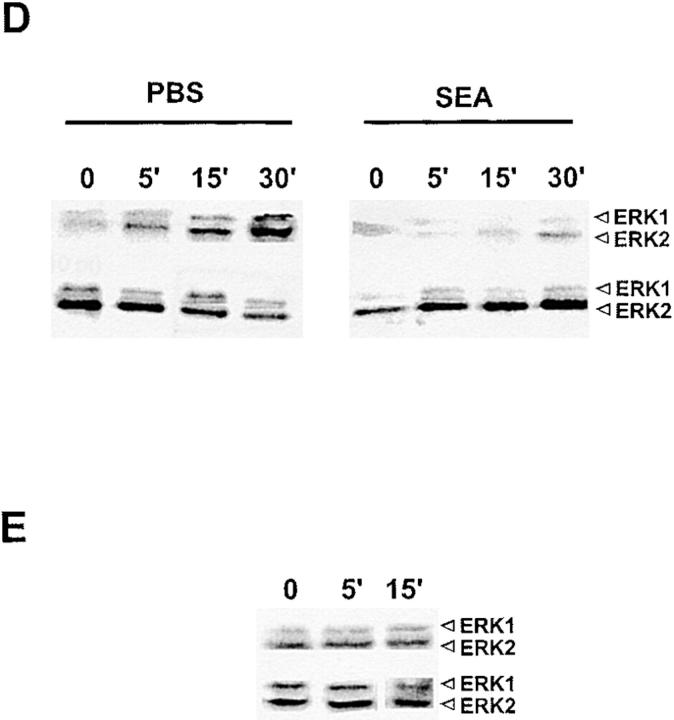
Recombinant-activating gene 2 (RAG-2-/-) T cell receptor-transgenic mice repeatedly injected with the superantigen staphylococcal enterotoxin A entered a tolerant state in which splenic CD4+ T cells produced little interleukin (IL)-2, interferon gamma, or IL-4. This state resulted from a combination of both clonal anergy and cytokine-mediated immunosuppression. The anergy persisted for at least 3 wk and could be distinguished from the suppression by a decrease in IL-2 production per cell, a block in the activation of early response kinases, and a failure to be reversed with anti-transforming growth factor (TGF)-beta. Full suppression lasted for only 1 wk and involved both IL-10 and TGF-beta, but required additional unknown molecules for optimal effect. These experiments show that complex in vivo interactions of multiple peripheral tolerance mechanisms can now be dissected at both the cellular and molecular levels.


Figures

Figure 1
Figure 1
Spleen cells from SEA-treated B10.A TCR–Cyt 5C.C7-1 RAG-2−/− mice exhibit profound blocks in proliferation, IL-2 production, and responsiveness to IL-2. (A) 105 spleen cells isolated from SEA- and PBS-injected mice were stimulated with 1 μM PCC peptide in the presence of 5 × 10⁵ T-depleted, irradiated B10.A spleen cells for 48 h. In some groups, IL-2 (10 U/ml) was added in the beginning to assess responsiveness to this cytokine. Culture supernatants were harvested, the cultures were assayed for proliferation by [3H]thymidine incorporation, and the amount of IL-2 in the supernatant was measured by a CTL-L assay in the groups without added IL-2. Data represent the mean ± SD of 11 separate experiments and are expressed as a percentage of the PBS control. (B) Total mRNA was isolated from 106 spleen cells from SEA-treated or control PBS-treated animals after stimulation with a combination of anti-CD3/anti-CD28 (day 4), antigen plus APCs (day 20), or no stimulation (day 4 and day 20). The amount of IL-2 message was determined by quantitative PCR analysis using specific primers (see Materials and Methods). H-2K mRNA was amplified as a control for the amount of RNA present in the reaction mixture. (C) Spleen cells were stimulated for 24 h with plate-bound anti-CD3 (3 μg) plus anti-CD28 (1:1,000 dilution ascites) antibodies, and then analyzed by FACS®. Cells were gated on the CD4+ population and analyzed for IL-2Rα (CD25) expression. Data shown is representative of four separate experiments.
Figure 4
Figure 4
The suppression mediated by the supernatants can be blocked with antibodies to IL-10 and TGF-β; however, only anti–TGF-β antibody can partially restore IL-2 production in cultures of SEA-treated spleen cells. (A) 105 naive spleen cells were cultured with 1 μM PCC peptide and 5 × 10⁵ T-depleted, irradiated B10.A spleen cells for 48 h in the presence of supernatant from stimulated cultures of SEA-treated mice (1:3, vol/vol), and in the presence or absence of the indicated antibodies at 10 μg/ml. The experiment is representative of three performed. (B) Spleen cells (105) from SEA-treated mice were cultured with 1 μM PCC peptide and 5 × 10⁵ irradiated, T-depleted B10.A spleen cells for 48 h alone or with the indicated antibodies at 10 μg/ml. Supernatants were then harvested and IL-2 production was measured with a CTL-L assay. The experiment was performed three times with similar results.
Figure 2
Figure 2
The frequency of IL-2–producing cells in the spleens of SEA-treated mice increases over time after injection of SEA, whereas the amount of IL-2 produced per cell remains low. (A) Spleen cells from SEA-treated mice were plated at decreasing cell numbers with 4,000 purified dendritic cells and 1 μM PCC peptide in 96-well plates. After 48 h in culture, the plates were frozen, then thawed, and 1,000 CTL-L cells were added to the wells. The wells were pulsed with [3H]thymidine and assayed for IL-2 production (thymidine incorporation) 6 h later. The amount of IL-2 on a per cell basis per time point was assayed by using the dilution of cells at which 37% (or more) of the wells were negative (plating efficiency of 1 cell per well) and plotting the cpm per well. Results from two separate experiments are shown. (B) The frequency of IL-2–producing cells per well is shown by plotting the number of cells per well against the logarithm of the fraction of nonresponding wells. This analysis was done on the data in experiment 1 shown in A. (C) Values represent mean ± SEM from the limiting dilution analysis in A, at a point where one cell or less per well was plated (see Materials and Methods). The asterisk denotes a statistically significant difference from PBS controls (P < 0.05) by analysis of variance.
Figure 2
Figure 2
The frequency of IL-2–producing cells in the spleens of SEA-treated mice increases over time after injection of SEA, whereas the amount of IL-2 produced per cell remains low. (A) Spleen cells from SEA-treated mice were plated at decreasing cell numbers with 4,000 purified dendritic cells and 1 μM PCC peptide in 96-well plates. After 48 h in culture, the plates were frozen, then thawed, and 1,000 CTL-L cells were added to the wells. The wells were pulsed with [3H]thymidine and assayed for IL-2 production (thymidine incorporation) 6 h later. The amount of IL-2 on a per cell basis per time point was assayed by using the dilution of cells at which 37% (or more) of the wells were negative (plating efficiency of 1 cell per well) and plotting the cpm per well. Results from two separate experiments are shown. (B) The frequency of IL-2–producing cells per well is shown by plotting the number of cells per well against the logarithm of the fraction of nonresponding wells. This analysis was done on the data in experiment 1 shown in A. (C) Values represent mean ± SEM from the limiting dilution analysis in A, at a point where one cell or less per well was plated (see Materials and Methods). The asterisk denotes a statistically significant difference from PBS controls (P < 0.05) by analysis of variance.
Figure 3
Figure 3
CD4+ spleen cells from SEA-treated animals can suppress IL-2 production from stimulated naive spleen cells, and the effect diminishes with time. (A) 105 spleen cells alone from SEA-treated, PBS-treated, or mixtures of 105 or 5 × 10⁴ PBS-treated plus SEA-treated spleen cells, were cultured with 1 μM PCC peptide in the presence of 5 × 10⁵ T-depleted irradiated B10.A spleen cells for 48 h. Culture supernatants were harvested and IL-2 production was measured by a CTL-L assay. The experiment from day 4 was repeated 10 times, and those from days 5, 6, and 20 were repeated four times with similar results. (B) Spleen cells from SEA- or PBS-treated mice were stained with anti-CD4 or anti-CD8 antibodies and were FACS® sorted. Purified CD4+ or CD8+ T cells (105) from SEA-treated mice were cultured with 105 purified CD4+ T cells from PBS-treated mice in the presence of 1 μM PCC peptide and 5 × 10⁵ T-depleted, irradiated spleen cells for 48 h (purity shown at top). Supernatants were then harvested and assayed for IL-2 production by CTL-L assay. Results from mixtures using unfractionated cells are shown for comparison. The CD4+ and CD8+ sorts are from separate experiments. Each experiment was performed three times.
Figure 5
Figure 5
ERK activation is diminished in spleen cells from SEA-treated mice. (A) Time course of activation for B10.A TCR–Cyt 5C.C7-1 RAG−/− spleen cells. 7 × 10⁶ cells were incubated on anti-CD3 (2C11)-coated plates for the indicated times (top). Total ERK protein levels are shown underneath. (B) ERK activation in PBS- versus SEA-treated spleen cells. 7 × 10⁶ cells were left unstimulated (U) or stimulated on anti-CD3–coated plates for 15 min (S). Total ERK protein levels are shown underneath. (C) Time course of ERK activation in SEA-treated spleen cells at day 4 after a third injection with SEA. CD8+ T cells were depleted from both populations giving 55% CD4+ cells in the control and 70% CD4+ cells in the SEA-treated spleen. 7 × 10⁶ cells were incubated on anti-CD3–coated plates for the indicated times (top). Total ERK protein levels are shown underneath. (D) Time course of ERK activation in SEA-treated spleen cells at day 20 after a third injection with SEA. 7 × 10⁶ cells were incubated on anti-CD3–coated plates for the indicated times (top). Total ERK protein levels are shown underneath. (E) Supernatants from stimulated SEA-treated spleen cells do not diminish ERK activation in stimulated naive spleen cells. Naive B10.A-TCR–Cyt 5C.C7-1 RAG-2−/− spleen cells were incubated for the indicated times in the presence of supernatant from stimulated SEA-treated spleen cells at day 4 after a third injection with SEA. The spleen cells were then stimulated on anti-CD3–coated plates for 15 min in the continued presence of the supernatant. Total ERK protein levels are shown underneath.
Figure 5
Figure 5
ERK activation is diminished in spleen cells from SEA-treated mice. (A) Time course of activation for B10.A TCR–Cyt 5C.C7-1 RAG−/− spleen cells. 7 × 10⁶ cells were incubated on anti-CD3 (2C11)-coated plates for the indicated times (top). Total ERK protein levels are shown underneath. (B) ERK activation in PBS- versus SEA-treated spleen cells. 7 × 10⁶ cells were left unstimulated (U) or stimulated on anti-CD3–coated plates for 15 min (S). Total ERK protein levels are shown underneath. (C) Time course of ERK activation in SEA-treated spleen cells at day 4 after a third injection with SEA. CD8+ T cells were depleted from both populations giving 55% CD4+ cells in the control and 70% CD4+ cells in the SEA-treated spleen. 7 × 10⁶ cells were incubated on anti-CD3–coated plates for the indicated times (top). Total ERK protein levels are shown underneath. (D) Time course of ERK activation in SEA-treated spleen cells at day 20 after a third injection with SEA. 7 × 10⁶ cells were incubated on anti-CD3–coated plates for the indicated times (top). Total ERK protein levels are shown underneath. (E) Supernatants from stimulated SEA-treated spleen cells do not diminish ERK activation in stimulated naive spleen cells. Naive B10.A-TCR–Cyt 5C.C7-1 RAG-2−/− spleen cells were incubated for the indicated times in the presence of supernatant from stimulated SEA-treated spleen cells at day 4 after a third injection with SEA. The spleen cells were then stimulated on anti-CD3–coated plates for 15 min in the continued presence of the supernatant. Total ERK protein levels are shown underneath.

Similar articles

Cited by

References

    1. Ramsdell F., Fowlkes B.J. Clonal deletion versus clonal anergythe role of the thymus in inducing self tolerance. Science. 1990;248:1342–1348. - PubMed
    1. Moskophidis D., Lechner F., Pircher H., Zinkernagel R.M. Virus persistence in acutely infected immunocompetent mice by exhaustion of antiviral cytotoxic effector T cells. Nature. 1993;362:758–761. - PubMed
    1. Rammensee H.G., Kroschewski R., Frangoulis B. Clonal anergy induced in mature V beta 6+ T lymphocytes on immunizing Mls-1 b mice with Mls-1 a expressing cells. Nature. 1989;339:541–544. - PubMed
    1. Webb S.R., Hutchinson J., Hayden K., Sprent J. Expansion/deletion of mature T cells exposed to endogenous superantigen in vivo. J. Immunol. 1994;152:586–596. - PubMed
    1. McCormack J.E., Callahan J.E., Kappler J., Marrack P.C. Profound deletion of mature T cells in vivo by chronic exposure to endogenous superantigen. J. Immunol. 1993;150:3785–3792. - PubMed

MeSH terms