. 1999 Jul 5;190(1):75-89.
doi: 10.1084/jem.190.1.75.

B cell development in the spleen takes place in discrete steps and is determined by the quality of B cell receptor-derived signals

Affiliations

B cell development in the spleen takes place in discrete steps and is determined by the quality of B cell receptor-derived signals

F Loder et al. J Exp Med. .

Abstract

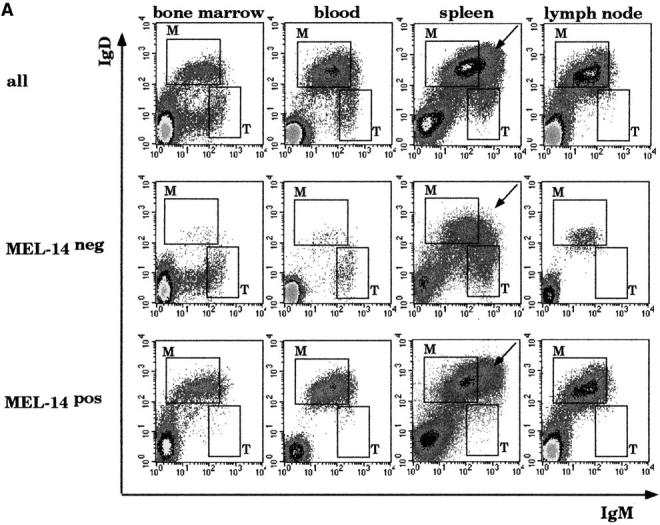
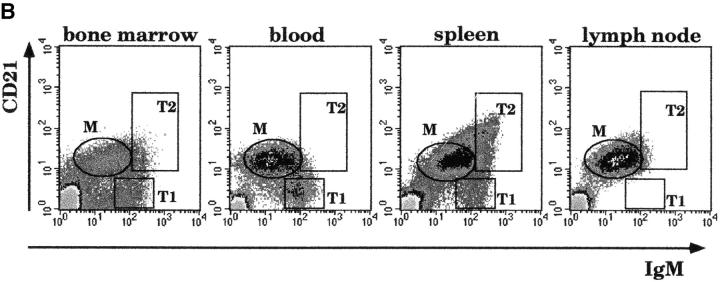
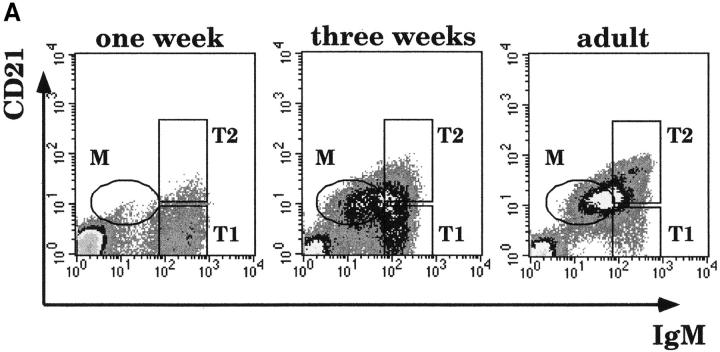
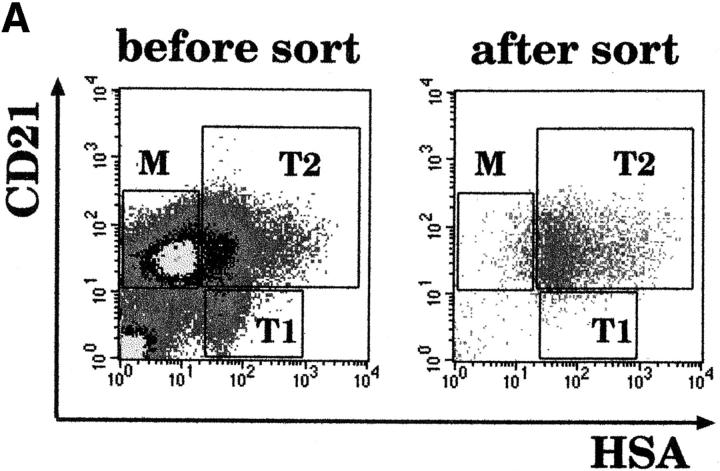
Only mature B lymphocytes can enter the lymphoid follicles of spleen and lymph nodes and thus efficiently participate in the immune response. Mature, long-lived B lymphocytes derive from short-lived precursors generated in the bone marrow. We show that selection into the mature pool is an active process and takes place in the spleen. Two populations of splenic B cells were identified as precursors for mature B cells. Transitional B cells of type 1 (T1) are recent immigrants from the bone marrow. They develop into the transitional B cells of type 2 (T2), which are cycling and found exclusively in the primary follicles of the spleen. Mature B cells can be generated from T1 or T2 B cells. Mice with genetic deletions of elements participating in the B cell receptor signaling cascade display developmental arrest at the T1 or T2 stage. The analysis of these defects showed that the development of T2 and mature B cells from T1 precursors requires defined qualitative and quantitative signals derived from the B cell receptor and that the induction of longevity and maturation requires different signals.


Figures

Figure 1
Figure 1
Transitional B cells of normal mice. Three-color flow cytometric analysis of cells isolated from bone marrow, blood, spleens, and lymph nodes of adult C57BL/6 mice. 100,000 events were collected. (A) Log density plots showing IgD and IgM expression. Top, all cells; center, MEL-14 cells; bottom, MEL-14+ cells. M, mature B cells; T, transitional B cells. Arrows, cells that are indicated as T2 in panel B. (B) Cells were stained with Abs to IgM and CD21. M, mature B cells; T1, CD21 and T2, CD21bright transi-tional B cells. (C) Splenocytes were stained with Abs to IgM, IgD, and CD23. The plots show the IgD and IgM staining of cells separated on the basis of the expression of CD23. CD23 B cells include IgMbright IgD T1, and MZ B cells and all IgM cells in the spleen (T cells and macrophages). Only B cells are positive for CD23. They are mostly T2 and mature (M) B cells. (D) Splenocytes were stained with Abs to IgD, CD21, and IgM and separated into IgD or IgD+ cells. IgD T1 and MZ B cells can be distinguished on the basis of CD21 expression. T2 and mature B cells are both in the gate of the IgD+ B cells but are either bright (T2) or dull (M) for IgM.
Figure 1
Figure 1
Transitional B cells of normal mice. Three-color flow cytometric analysis of cells isolated from bone marrow, blood, spleens, and lymph nodes of adult C57BL/6 mice. 100,000 events were collected. (A) Log density plots showing IgD and IgM expression. Top, all cells; center, MEL-14 cells; bottom, MEL-14+ cells. M, mature B cells; T, transitional B cells. Arrows, cells that are indicated as T2 in panel B. (B) Cells were stained with Abs to IgM and CD21. M, mature B cells; T1, CD21 and T2, CD21bright transi-tional B cells. (C) Splenocytes were stained with Abs to IgM, IgD, and CD23. The plots show the IgD and IgM staining of cells separated on the basis of the expression of CD23. CD23 B cells include IgMbright IgD T1, and MZ B cells and all IgM cells in the spleen (T cells and macrophages). Only B cells are positive for CD23. They are mostly T2 and mature (M) B cells. (D) Splenocytes were stained with Abs to IgD, CD21, and IgM and separated into IgD or IgD+ cells. IgD T1 and MZ B cells can be distinguished on the basis of CD21 expression. T2 and mature B cells are both in the gate of the IgD+ B cells but are either bright (T2) or dull (M) for IgM.
Figure 2
Figure 2
T1 B cells are the precursors of T2 and mature B cells. (A) Splenocytes of 1- (left) and 3- (center) wk-old and adult (right) C57BL/6 mice were stained with Abs to CD21 and IgM and analyzed by flow cytometry. (B) Splenic cells from recipient RAG-2−/− mice were analyzed at the indicated times after transfer of 2 × 10⁶ splenic B cells from a pool of 1-wk-old mice. Cells were stained with Abs to IgM, IgD, and CD21. Top panels, IgM vs. IgD staining. Bottom panels, the CD21 vs. IgM profile of IgD+IgM+ donor B cells. 200,000 events were collected. Data is shown as dot plots to highlight the few transferred cells that home to the spleen. In the dot plots corresponding to the control (adult) spleen, only 5% of the collected events are shown.
Figure 2
Figure 2
T1 B cells are the precursors of T2 and mature B cells. (A) Splenocytes of 1- (left) and 3- (center) wk-old and adult (right) C57BL/6 mice were stained with Abs to CD21 and IgM and analyzed by flow cytometry. (B) Splenic cells from recipient RAG-2−/− mice were analyzed at the indicated times after transfer of 2 × 10⁶ splenic B cells from a pool of 1-wk-old mice. Cells were stained with Abs to IgM, IgD, and CD21. Top panels, IgM vs. IgD staining. Bottom panels, the CD21 vs. IgM profile of IgD+IgM+ donor B cells. 200,000 events were collected. Data is shown as dot plots to highlight the few transferred cells that home to the spleen. In the dot plots corresponding to the control (adult) spleen, only 5% of the collected events are shown.
Figure 3
Figure 3
T2 B cells develop into mature B cells in the spleen. (A) Spleen cells of adult mice were stained with Abs to HSA and CD21, and T1, T2, and mature (M) B cells were identified (before sort). CD21+HSAbright T2 B cells were sorted (after sort) and transferred into adult RAG-2−/− recipient mice. (B) The spleens of recipient RAG-2−/− mice were analyzed 24 h after transfer and compared with the spleen of an adult control mouse. T1, T2, and mature B cells were identified on the basis of the expression of HSA, B220, IgM, and IgD. The plots show the IgD and IgM staining of cells that were positive for B220 and either bright or dull for HSA.
Figure 3
Figure 3
T2 B cells develop into mature B cells in the spleen. (A) Spleen cells of adult mice were stained with Abs to HSA and CD21, and T1, T2, and mature (M) B cells were identified (before sort). CD21+HSAbright T2 B cells were sorted (after sort) and transferred into adult RAG-2−/− recipient mice. (B) The spleens of recipient RAG-2−/− mice were analyzed 24 h after transfer and compared with the spleen of an adult control mouse. T1, T2, and mature B cells were identified on the basis of the expression of HSA, B220, IgM, and IgD. The plots show the IgD and IgM staining of cells that were positive for B220 and either bright or dull for HSA.
Figure 4
Figure 4
T2 B cells are in the primary follicle of normal mice. (A) Sections of normal spleen were fixed and stained with TRITC-labeled goat anti–mouse IgM and FITC-labeled anti-mouse IgD. Green and red fluorescence were measured separately by confocal laser microscopy, and the pictures obtained were then overlaid (magnification 100). M, mature B cells. (B) The sector indicated by the square in A was scanned with a 250-fold amplification to better visualize single cells. T1 B cells (red) are indicated by the single-headed arrow and T2 (yellow) by the double-headed arrow. Mature B cells are green.
Figure 4
Figure 4
T2 B cells are in the primary follicle of normal mice. (A) Sections of normal spleen were fixed and stained with TRITC-labeled goat anti–mouse IgM and FITC-labeled anti-mouse IgD. Green and red fluorescence were measured separately by confocal laser microscopy, and the pictures obtained were then overlaid (magnification 100). M, mature B cells. (B) The sector indicated by the square in A was scanned with a 250-fold amplification to better visualize single cells. T1 B cells (red) are indicated by the single-headed arrow and T2 (yellow) by the double-headed arrow. Mature B cells are green.
Figure 5
Figure 5
B cell development is blocked at the T2 stage in CD45−/− and CBA/N mice, but the number and the phenotype of MZ B cells is normal. Flow cytometric analysis of splenic B cells from normal C57BL/6 (control) and CD45−/− and CBA/N mice. (A) Cells were stained with Abs to IgM and IgD. T1, T2, and mature (M) B cells are boxed. (B) Cells were stained with Abs to CD23, CD21, and IgM and separated into CD23 and CD23+ cells. T1, T2, MZ, and mature B cells were identified as in Fig. 1 C. The fraction of T2 B cells represented 23% of all B cells in the normal mouse spleen, 55% in the CD45−/− spleen, and 50% in the CBA/N spleen.
Figure 5
Figure 5
B cell development is blocked at the T2 stage in CD45−/− and CBA/N mice, but the number and the phenotype of MZ B cells is normal. Flow cytometric analysis of splenic B cells from normal C57BL/6 (control) and CD45−/− and CBA/N mice. (A) Cells were stained with Abs to IgM and IgD. T1, T2, and mature (M) B cells are boxed. (B) Cells were stained with Abs to CD23, CD21, and IgM and separated into CD23 and CD23+ cells. T1, T2, MZ, and mature B cells were identified as in Fig. 1 C. The fraction of T2 B cells represented 23% of all B cells in the normal mouse spleen, 55% in the CD45−/− spleen, and 50% in the CBA/N spleen.
Figure 6
Figure 6
Absolute number of T2 and mature (M) splenic B cells in normal, CD45−/−, and CBA/N and in CD45−/−CBA/N double-mutant mice. Cell numbers were calculated using the gates shown in Fig. 5. Stippled bar, normal; gray bar, CD45−/−; black bar, CBA/N; hatched bar, double mutant.
Figure 7
Figure 7
Kinetics of BrdU labeling of B lymphocytes of normal and mutant mice. Mice received BrdU (1 mg/ml) in their drinking water for the indicated times. Splenic B cell populations were identified on the basis of three different surface staining protocols: IgM vs. IgD, IgM vs. CD21, and IgD vs. CD22. The BrdU content of the cells was determined by flow cytometry. The experiments were repeated three times, and comparable results were obtained. The columns represent the percentages of BrdU-labeled B cells in normal and mutant mice analyzed 24 (stippled bars) and 72 h (gray bars) after the beginning of the BrdU administration. The percentage of B cells still labeled 18 d after a 3-d treatment with BrdU (18-d chase; black bars) is also shown. The absolute numbers of labeled B cells in the normal spleen were 2 × 10⁶ after 24 h, 5.6 × 10⁶ after 3 d, and 0.9 × 10⁶ after the 18-d chase. In the CD45−/− mouse, 35 × 106 B cells were labeled after 24 h and 37.8 × 10⁶ after 3 d. 0.8 × 10⁶ B cells were still labeled after the 18-d chase. The CBA/N mouse had 2.4 × 10⁶ labeled B cells on day 1 and 3.2 × 10⁶ on day 3. Only 0.1 × 10⁶ cells were still labeled after the chase.
Figure 9
Figure 9
Primary follicles of mutant mice show normal architecture. Cryostatic sections of spleens from normal and mutant mice were stained with TRITC-labeled goat anti–mouse IgM Abs. Anti–MAdCAM-1 Abs (from rats) were counterstained with FITC-labeled goat anti–rat Abs. Green and red fluorescence was measured separately by confocal laser microscopy, and the pictures obtained were then overlaid (magnification 100). The arrow points to the thin layer of MAdCAM-1–positive endothelial cells of the marginal sinus. F, follicle.
Figure 9
Figure 9
Primary follicles of mutant mice show normal architecture. Cryostatic sections of spleens from normal and mutant mice were stained with TRITC-labeled goat anti–mouse IgM Abs. Anti–MAdCAM-1 Abs (from rats) were counterstained with FITC-labeled goat anti–rat Abs. Green and red fluorescence was measured separately by confocal laser microscopy, and the pictures obtained were then overlaid (magnification 100). The arrow points to the thin layer of MAdCAM-1–positive endothelial cells of the marginal sinus. F, follicle.
Figure 8
Figure 8
Development of T2 and mature B cells is blocked in mice lacking the cytoplasmic tail of Ig-α. Spleen cells of mb1 Δc/Δc (left), CD45−/− (center), and mb1 Δc/Δc-CD45−/− double-mutant (right) mice were stained with Abs to CD21 and IgM. Flow cytometric profiles are shown. Dead cells, which fail to exclude the dye propidium iodide, were excluded from the analysis. 100,000 events were collected.
Figure 10
Figure 10
Proposed developmental pathways of B cells in the spleen. The B cell subpopulations described in this paper are depicted as they would appear in a flow cytometric profile after staining with anti-IgM and anti-CD21 Abs. T1 B cells recently immigrated from the bone marrow develop into T2 B cells if they receive a BCR-mediated signal. This signal is insufficient in Ig-α– and Syk-deficient mice. Progression of T2 B cells into the mature long-lived pool (M) is blocked in mice with qualitative and quantitative defects in BCR signaling function, as in Btk-, Vav-, Lyn-, and CD45−/− mice, and in transgenic mice with a dominant-negative form of MEK (DN-MEK), which is only expressed in B cells. MZ B cells are thought to derive from mature B cells but are also found in mice with a developmental arrest at the T2 stage, leaving open the possibility that they can also be derived from T2 B cells. It is presently unclear whether T1 B cells can directly differentiate into mature cells in the spleen. Solid arrows, major pathways; broken arrows, possible pathways; ⊥, pathway blocked; *inferred from the literature; **our unpublished data.

Similar articles

Cited by

References

    1. Rolink A., Melchers F. B-cell development in the mouse. Immunol. Lett. 1996;54:157–161. - PubMed
    1. Reth M. The B-cell antigen receptor complex and co-receptors. Immunol. Today. 1995;16:310–313. - PubMed
    1. Carsetti R., Kohler G., Lamers M.C. Transitional B cells are the target of negative selection in the B cell compartment. J. Exp. Med. 1995;181:2129–2140. - PMC - PubMed
    1. Jacobsen K., Osmond D.G. Microenvironmental organization and stromal cell associations of B lymphocyte precursor cells in mouse bone marrow. Eur. J. Immunol. 1990;20:2395–2404. - PubMed
    1. Allman D.M., Ferguson S.E., Lentz V.M., Cancro M.P. Peripheral B cell maturation. II. Heat-stable antigen(hi) splenic B cells are an immature developmental intermediate in the production of long-lived marrow-derived B cells. J. Immunol. 1993;151:4431–4444. - PubMed

Publication types

MeSH terms

Substances