. 1999 Aug 3;96(16):9068-73.
doi: 10.1073/pnas.96.16.9068.

Understanding beta-hairpin formation

Affiliations

Understanding beta-hairpin formation

A R Dinner et al. Proc Natl Acad Sci U S A. .

Abstract

The kinetics of formation of protein structural motifs (e.g., alpha-helices and beta-hairpins) can provide information about the early events in protein folding. A recent study has used fluorescence measurements to monitor the folding thermodynamics and kinetics of a 16-residue beta-hairpin. In the present paper, we obtain the free energy surface and conformations involved in the folding of an atomistic model for the beta-hairpin from multicanonical Monte Carlo simulations. The results suggest that folding proceeds by a collapse that is downhill in free energy, followed by rearrangement to form a structure with part of the hydrophobic cluster; the hairpin hydrogen bonds propagate outwards in both directions from the partial cluster. Such a folding mechanism differs from the published interpretation of the experimental results, which is based on a helix-coil-type phenomenological model.


Figures

Figure 1
Figure 1
Native hairpin structure. (a) Space-filling model of the hydrophobic cluster for the minimized coordinates extracted from the NMR structure of the complete Ig-binding domain of protein G (Protein Data Bank code 2gb1) (13). (b) Schematic. Backbone hydrogen bonds contributing to the sheet are indicated by dashed lines and numbered. In general, we count a hydrogen bond if the corresponding heavy atoms are within 3.4 Å of each other and the out-of-line angle (180°− ∡DHA) is less than 70°. Arrows indicate the pairwise distances used in the cluster analysis: D47H–A48H, A48H–T49H, T49H–K50H, K50H–T51H, W43Cα–V54Cα, Y45Cα–F52Cα, W43Cɛ3–F52Cβ, Y45Cβ–F52Cγ, and D47Cα–F52Cγ.
Figure 2
Figure 2
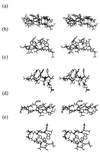
Stereo views of minimized average structures of high probability clusters at 300 K. (a) The most probable cluster (black) (10.7%) compared with the structure shown in Fig. 1 a (gray). (b–e) Clusters with overall rms deviations from the native structure of more than 3.0 Å.
Figure 3
Figure 3
Two-dimensional projections of the free energy. (a) The free energy as a function of the overall rms deviation from the native structure and the radius of gyration (Rg). (b) The free energy as a function of the overall rms deviation from the native structure and the ASA of the hydrophobic side chains (W43, Y45, F52, and V54); the ASA is measured with a 1.4-Å radius probe. (c) The free energy as a function of the number of native hairpin hydrogen bonds (NH) and the ASA of the hydrophobic side chains; see Fig. 1 for hydrogen bond definitions. The contours are spaced at intervals of 0.5 kcal/mol and range from blue for low (favorable) values to red for high (unfavorable) values; contours more than 15 kcal/mol above the global free energy minimum are not drawn.
Figure 4
Figure 4
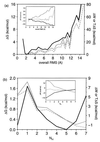
Free energy (ΔG, bold solid line, left scale) and its effective energetic (ΔW, thin solid line, right scale) and entropic (TΔS, thin dashed line, right scale) components as functions of (a) the overall rms deviation from the native structure (Fig. 1a) and (b) the number of native sheet hydrogen bonds. (Inset) The average total bonded energy (dashed line), the average total intramolecular nonbonded energy (thin solid line), and the average solvent effective energy (bold solid line).
Figure 5
Figure 5
Temperature dependence of total (solid line) and individual (dashed line) populations of native sheet hydrogen bonds; numbers correspond to those in Fig. 1b. See Fig. 1 legend for hydrogen bond criteria.
Figure 6
Figure 6
Free energy as a function of the number of native peptide bonds (Nω). The black solid line is for the total number of native peptide bonds. The dashed line represents the “standard” single sequence approximation (31) and the gray line represents the “modified” single sequence approximation (ref. ; see text).

References

    1. Karplus M. Folding Des. 1997;2:S69–S75. - PubMed
    1. Dill K A, Chan H S. Nat Struct Biol. 1997;4:10–19. - PubMed
    1. Wolynes P G, Onuchic J N, Thirumalai D. Science. 1995;267:1619–1620. - PubMed
    1. Dobson C M, Karplus M, Šali A. Angew Chem Int Ed. 1998;37:868–893. - PubMed
    1. Dobson C M, Evans P A, Radford S E. Trends Biochem Sci. 1994;19:31–37. - PubMed

Publication types

LinkOut - more resources