. 1999 Aug 3;96(16):9077-82.
doi: 10.1073/pnas.96.16.9077.

Ligand-induced conformational changes observed in single RNA molecules

Affiliations

Ligand-induced conformational changes observed in single RNA molecules

T Ha et al. Proc Natl Acad Sci U S A. .

Abstract

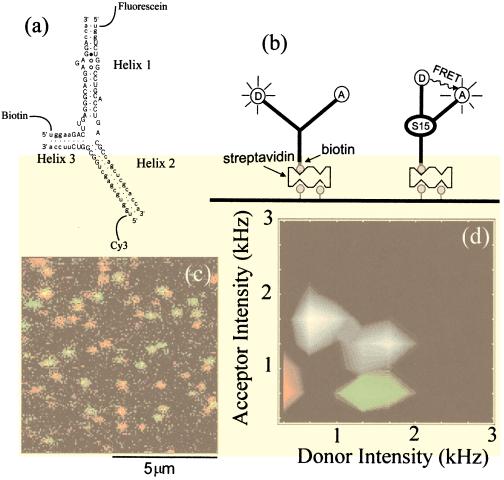
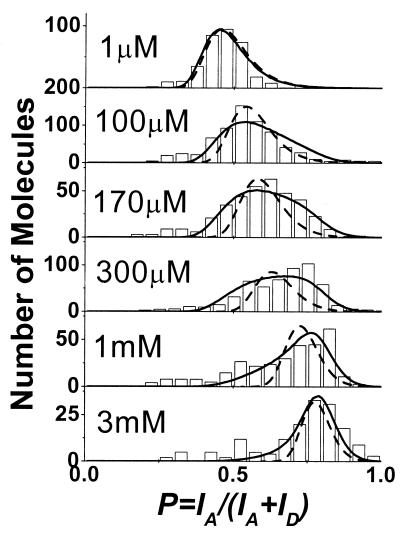
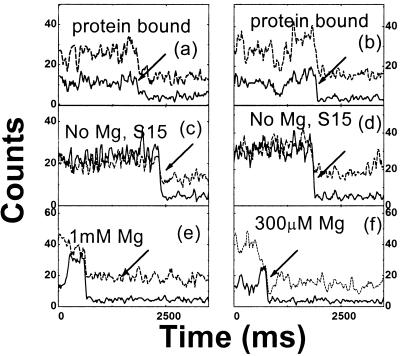
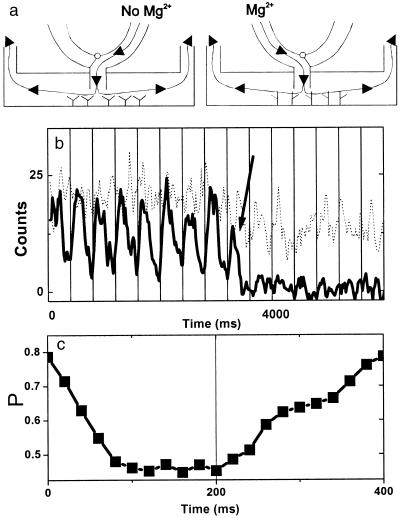
We present the first demonstration that fluorescence resonance energy transfer can be used to track the motion of a single molecule undergoing conformational changes. As a model system, the conformational changes of individual three-helix junction RNA molecules induced by the binding of ribosomal protein S15 or Mg(2+) ions were studied by changes in single-molecule fluorescence. The transition from an open to a folded configuration was monitored by the change of fluorescence resonance energy transfer between two different dye molecules attached to the ends of two helices in the RNA junction. Averaged behavior of RNA molecules closely resembles that of unlabeled molecules in solution determined by other bulk assays, proving that this approach is viable and suggesting new opportunities for studying protein-nucleic acids interactions. Surprisingly, we observed an anomalously broad distribution of RNA conformations at intermediate ion concentrations that may be attributed to foldability differences among RNA molecules. In addition, an experimental scheme was developed where the real-time response of single molecules can be followed under changing environments. As a demonstration, we repeatedly changed Mg(2+) concentration in the buffer while monitoring single RNA molecules and showed that individual RNA molecules can measure the instantaneous Mg(2+) concentration with 20-ms time resolution, making it the world's smallest Mg(2+) meter.


Figures

Figure 1
Figure 1
(a) RNA junction with fluorescein, Cy3 and biotin labeling. Functionally important bases are marked by uppercase letters. (b) Cartoon of RNA conformational change on protein/Mg binding. Interhelix angles are taken from ref. . (c) Two-color overlay image of protein-bound and free RNA molecules (128 ×128 pixels, integration time for each pixel ≈5 ms). RNA molecules were preincubated with 3nM S15 protein solution before immobilization. The donor image (500 nm < λ < 540 nm) was pseudo-colored in green and the acceptor image (570 nm < λ < 610 nm) was pseudo-colored in red, and the two images were overlaid. The protein-bound RNA adopts a folded conformation, bringing the two dyes together, leading to significant donor quenching (red spots). The free RNA adopts an open conformation that has strong donor emission (green-yellow spots). Conformational state identification can be made quantitative by calculating the average intensity of two images over a rectangle (≈16 pixels) surrounding each molecule (if the dye photobleached during the scan, only the portion before the photobleaching was used). Donor average intensity and acceptor average intensity of ≈200 molecules from five images including c are represented as a two-dimensional histogram in d in gray scale. Each image is taken from a fresh area to avoid photobleaching caused by repeated exposure to the laser excitation. The peak at low donor intensity is caused by protein-bound RNA molecules and directly corresponds to the red spots in c, and the peak at high donor intensity corresponds to free RNA molecules or green spots in c. Distributions obtained from RNA molecules labeled with donor only and acceptor only are superimposed by using green and red, respectively.
Figure 2
Figure 2
(a) Initial proximity factor histograms after incubation with S15 protein solution of various concentration (0 M, 1 nM, 3 nM, 10 nM, 200 nM). Data (200 nM) were obtained by incubating preimmobilized RNA with the protein solution. Each histogram is fit with two Gaussian functions to estimate the protein-bound fraction. (b) Time sequence of single-molecule proximity factor histograms for RNA molecules preincubated with 3 nM S15 protein. Protein-bound fraction under P ≈ 0.75 peak decreases in time because of protein dissociation.
Figure 3
Figure 3
Proximity factor histograms of single RNA molecules for [Mg2+] = 1 μM, 100 μM, 170 μM, 300 μM, 1 mM, and 3 mM. Dashed lines are the expected distribution assuming only the dye variations and instrumental noise and do not match the broad distribution observed for intermediate [Mg2+]. Solid lines show the fits with the variability of KD, as described in the text.
Figure 4
Figure 4
Time traces of donor (solid lines) and acceptor (dotted lines) intensities from single RNA molecules. (a and b) Protein-bound RNA; (c and d) free RNA. (e) 1 mM Mg2+; (f) 300 μM Mg2+. Because fluorescein (donor) is much less photostable than Cy3 (acceptor), it photobleaches first most of the time, resulting in a sudden signal drop (marked by arrows). Acceptor signal caused by the direct excitation remains until its own photobleaching (not shown). Data points are taken every 20 ms and three-point averaging is used to reduce noise.
Figure 5
Figure 5
Real-time observation of single RNA molecule conformational changes on buffer exchange. (a) Schematics of the experimental apparatus showing how buffer is directly introduced on the area under observation to reduce the mixing time. (b) Time traces (integration time, 5 ms) of donor (solid line) and acceptor signal (dotted line) on buffer exchange. [Mg2+] was alternated between 0 and 1 mM every 200 ms (starting from 0). Significant donor signal reduction is seen every time Mg2+ buffer is present. Vertical grids denote buffer exchange periods (400 ms). Three-point averaging was applied to reduce noise. Donor photobleaching is marked by an arrow. (c) The average proximity factor over seven periods. The nominal arrival times for the buffer without Mg2++ and with 1 mM Mg2++ are at time = 0 and 200 ms. The transition is not abrupt because of the finite mixing time between the two buffers.

References

    1. Perkins T T, Smith D E, Chu S. Science. 1997;276:2016–2021. - PubMed
    1. Smith D E, Chu S. Science. 1998;281:1335–1340. - PubMed
    1. Selvin P R. Methods Enzymol. 1995;246:300–334. - PubMed
    1. Stryer L, Haugland R P. Proc Natl Acad Sci USA. 1967;58:719–730. - PMC - PubMed
    1. Ha T, Enderle T, Ogletree D F, Chemla D S, Selvin P R, Weiss S. Proc Natl Acad Sci USA. 1996;93:6264–6268. - PMC - PubMed

Publication types