Comparative Study
. 1999 Aug 3;96(16):9184-9.
doi: 10.1073/pnas.96.16.9184.

Genome signature comparisons among prokaryote, plasmid, and mitochondrial DNA

Affiliations
Comparative Study

Genome signature comparisons among prokaryote, plasmid, and mitochondrial DNA

A Campbell et al. Proc Natl Acad Sci U S A. .

Abstract

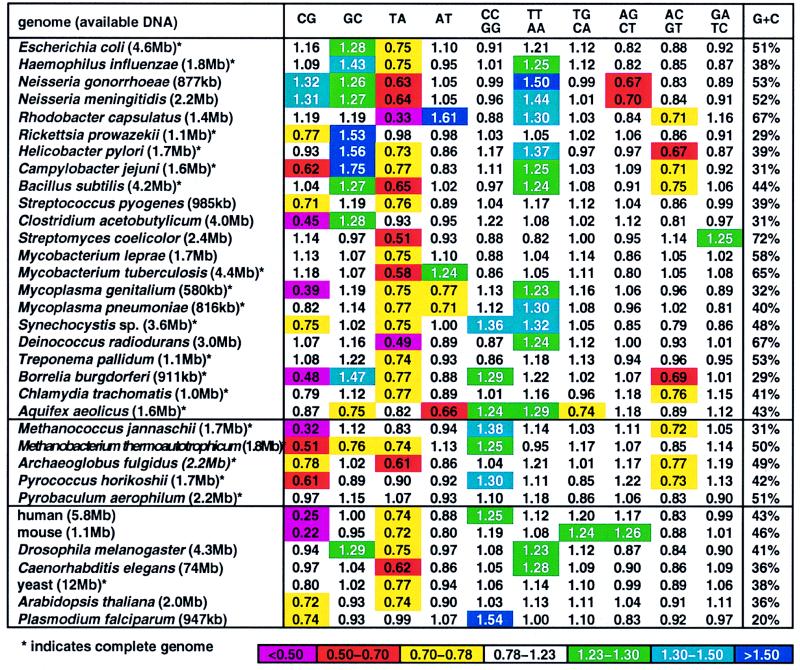
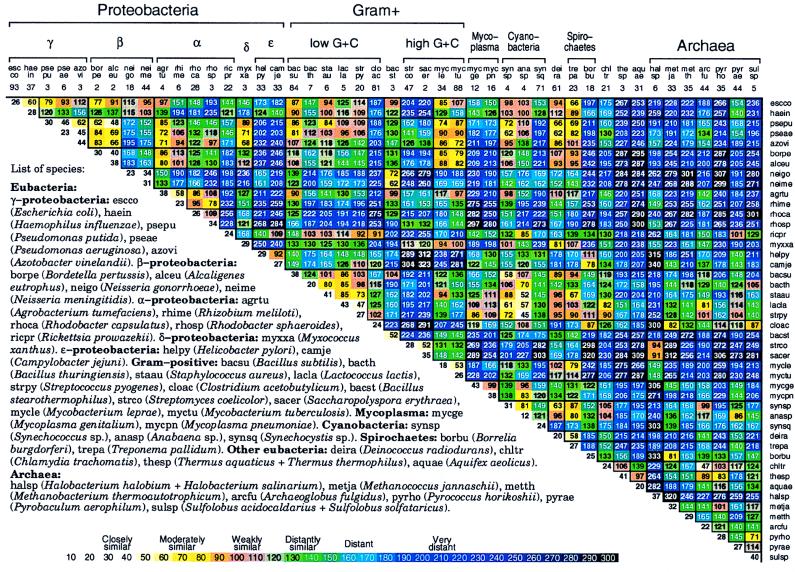
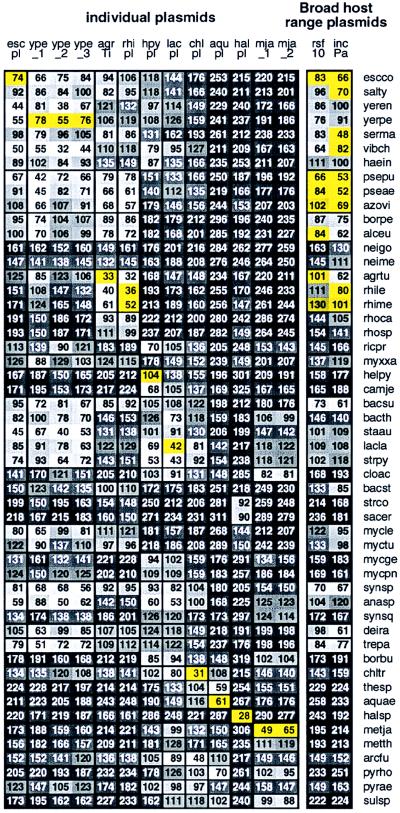
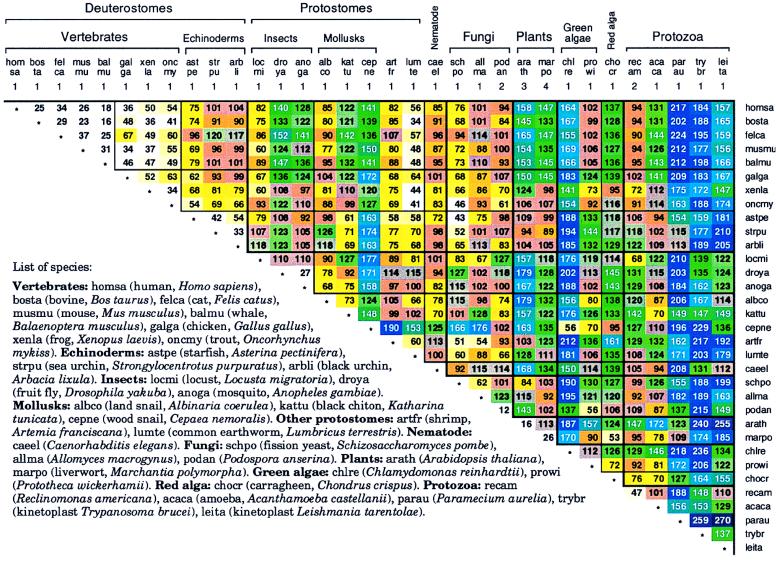
Our basic observation is that each genome has a characteristic "signature" defined as the ratios between the observed dinucleotide frequencies and the frequencies expected if neighbors were chosen at random (dinucleotide relative abundances). The remarkable fact is that the signature is relatively constant throughout the genome; i.e. , the patterns and levels of dinucleotide relative abundances of every 50-kb segment of the genome are about the same. Comparison of the signatures of different genomes provides a measure of similarity which has the advantage that it looks at all the DNA of an organism and does not depend on the ability to align homologous sequences of specific genes. Genome signature comparisons show that plasmids, both specialized and broad-range, and their hosts have substantially compatible (similar) genome signatures. Mammalian mitochondrial (Mt) genomes are very similar, and animal and fungal Mt are generally moderately similar, but they diverge significantly from plant and protist Mt sets. Moreover, Mt genome signature differences between species parallel the corresponding nuclear genome signature differences, despite large differences between Mt and host nuclear signatures. In signature terms, we find that the archaea are not a coherent clade. For example, Sulfolobus and Halobacterium are extremely divergent. There is no consistent pattern of signature differences among thermophiles. More generally, grouping prokaryotes by environmental criteria (e.g., habitat propensities, osmolarity tolerance, chemical conditions) reveals no correlations in genome signature.


Figures

Figure 1
Figure 1
Genome signature (dinucleotide relative abundances) of complete genomes and large DNA sequence samples (>500 kb).
Figure 2
Figure 2
Average δ* differences within (diagonal entries) and between (nondiagonal entries) prokaryotic DNA sequence samples based on pairwise comparisons of all disjoint nonredundant 50-kb samples available. See also Fig. 5 for 70 prokaryotic species [published as supplemental data on the PNAS web site (www.pnas.org)].
Figure 3
Figure 3
Plasmids are abbreviated as follows: rsf10 (broad-host-range plasmid RSF1010), incPa (Broad host range plasmid Birmingham IncP α), escpl (enterohemorrhagic E. coli plasmid pO157), ype_1 (Yersinia pestis plasmid pMT-1), ype_2 (Y. pestis plasmid pCD1), ype_3 (Y. pestis plasmid pPCP1), agrTi (A. tumefaciens plasmid Ti), rhipl (Rhizobium plasmid pNGR234a), hpypl (H. pylori plasmid pHPM186); lacpl (L. lactis DPC3147 plasmid pMRC01), chlpl (virulence cluster from C. trachomatis plasmid pCHL1), aqupl (A. aeolicus plasmid ece1), halpl (Halobacterium sp. NRC-1 plasmid), mja_1 (M. jannaschii large plasmid), mja_2 (M. jannaschii small plasmid). See Fig. 2 for prokaryotic species abbreviations. Additional prokaryotes not included in Fig. 2 are salty (Salmonella typhimurium), yeren (Yersinia enterocolitica), yerpe (Yersinia pestis), serma (Serratia marcescens), vibch (Vibrio cholerae), and rhile (Rhizobium leguminosarum). Yellow background indicates δ* differences of a plasmid from its confirmed host. See also Fig. 6, which is published as supplemental data on the PNAS web site (www.pnas.org).
Figure 4
Figure 4
Average δ* differences among complete Mt genomes based on a single sequence sample for genomes of <60 kb and multiple samples of about 50 kb for larger genomes.

References

    1. Karlin S, Burge C. Trends Genet. 1995;11:283–290. - PubMed
    1. Blaisdell B E, Campbell A M, Karlin S. Proc Natl Acad Sci USA. 1996;93:5854–5859. - PMC - PubMed
    1. Karlin S, Mrázek J, Campbell A M. J Bacteriol. 1997;179:3899–3913. - PMC - PubMed
    1. Josse J, Kaiser A D, Kornberg A. J Biol Chem. 1961;263:864–875. - PubMed
    1. Russell G J, Walker P M, Elton R A, Subak-Sharpe J H. J Mol Biol. 1976;108:1–23. - PubMed

Publication types