. 1999 Aug 3;96(16):9242-7.
doi: 10.1073/pnas.96.16.9242.

A silencer element identified in Drosophila is required for imprinting of H19 reporter transgenes in mice

Affiliations

A silencer element identified in Drosophila is required for imprinting of H19 reporter transgenes in mice

J D Brenton et al. Proc Natl Acad Sci U S A. .

Abstract

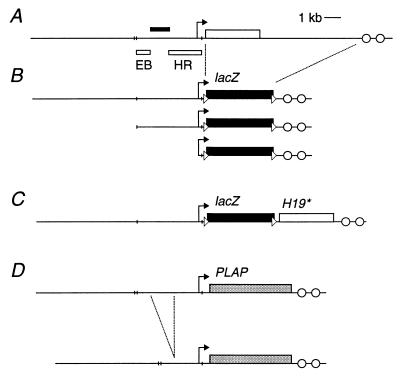
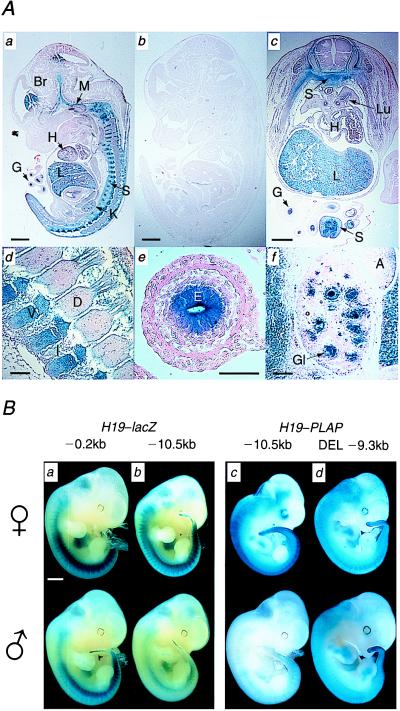
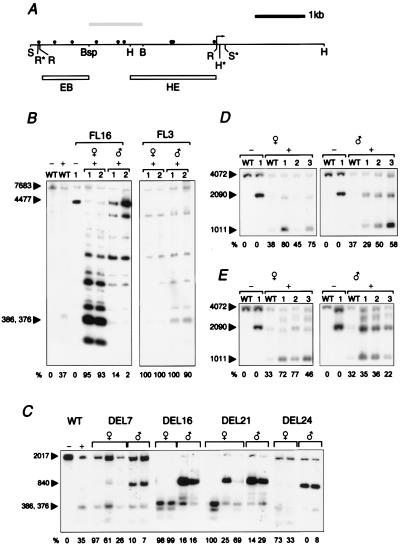
The H19 gene is subject to genomic imprinting because it is methylated and repressed after paternal inheritance and is unmethylated and expressed after maternal inheritance. We recently identified a 1.1-kb control element in the upstream region of the H19 gene that functions as a cis-acting silencer element in Drosophila. Here we investigate the function of this element in mice. We demonstrate that both H19-lacZ and H19-PLAP reporter transgenes can undergo imprinting with repression and hypermethylation after paternal transmission at many integration sites. However, transgenes that were deleted for the 1.1-kb silencer element showed loss of paternal repression, but they did not show marked changes in the paternal methylation of the remaining upstream region. This study demonstrates that the 1.1-kb control element identified in Drosophila is required to silence paternally transmitted H19 minitransgenes in mice.


Figures

Figure 1
Figure 1
Structure of the H19 genomic locus and reporter transgenes. (A) The H19 gene is depicted by the open rectangle with the arrow indicating the promoter (internal exon/intron boundaries not shown). The downstream enhancers are represented by open circles. The filled rectangle above the horizontal line indicates the position of the silencer region identified in Drosophila (20). The open rectangles below the line show the probes EB and HE that were used for methylation analysis. The short vertical lines indicate EcoRI sites. (B) H19lacZ transgenes with −10.5 kb, −3.8 kb, and −0.25 kb of upstream region (HGF23, HGF22, and HGF21, respectively). The filled rectangle represents the bacterial lacZ gene and the dashed lines show the region of the wild-type locus that has been replaced by the reporter. The loxP sites are depicted by triangles. (C) HGF20 transgenes were identical to HGF23 except that a 4-kb H19 genomic fragment containing an artificial polymorphism was inserted downstream of the lacZ poly(A) and 3′ loxP site. (D) H19PLAP and DEL–H19 transgenes with and without the silencer region. The gray rectangles depict the human PLAP genomic reporter (internal exon/intron boundaries not shown). The dashed lines show the 1.2-kb BspEI–BamHI deletion and the resulting DEL–H19 transgene has −9.3 kb of remaining upstream region.
Figure 2
Figure 2
(A) PLAP reporter gene expression in FL16 day 13.5 embryo after maternal and paternal transmission. (a) Midsagittal section after maternal transmission shows strong staining in liver, sclerotome, brain, meninges, and gut endoderm. Low levels of expression are seen in the heart. (b) Midsagittal section after paternal transmission shows complete repression of PLAP activity. (c) Transverse section through lower thoracic region after maternal transmission. The PLAP staining clearly shows the developing sclerotome, which is migrating dorsally to form the vertebral bodies and ventrally to form the cartilage and bones of the thoracic ribs. There is no expression in the spinal cord or dermatomyotome. Extracoloemic gut shows strong endothelial staining and some expression is also seen in the heart and bronchial epithelium of the lung. (d) Parasagittal view of upper thoracic vertebral column showing the formation of the vertebral bodies and intervertebral discs. (e) Sagittal section through extracoloemic gut showing high-level expression in the endoderm-derived endothelium. (f) Sagittal section through kidney showing PLAP expression in the developing glomeruli, but not in the tubules. Scale bar indicates 1 mm in a, b, and c and 0.1 mm in d, e, and f. A, adrenal gland; Br, brain; D, dorsal root ganglion; E, gut endothelium; G, gut; Gl, glomerulus; H, heart; I, intervertebral disk; L, liver; Lu, lung; K, kidney; M, meninges; S, sclerotome; V, vertebral body. (B) Repression of H19lacZ and H19PLAP transgenes requires the silencer region. Representative day-11.5 transgenic embryos stained as whole mount specimens for lacZ or PLAP activity after maternal (Upper) or paternal (Lower) transmission. The size of upstream region in the transgenic line is shown above the panel. (Scale bar indicates 1 mm.) The level of expression of the reporter gene was quantitated byusing Scion Image software (Scion, Frederick, MD). The mean density values for the embryos depicted were normalized against an equivalent embryo with no staining. (a) Line SCB01 shows very slight repression after paternal expression. Maternal expression = 64.41. Paternal expression = 62.04. (b) Paternal transmission of line MLK16.1 shows marked repression of lacZ, most notable in the sclerotome. Maternal expression = 55.16. Paternal expression = 34.64. (c) Line FL8 shows strong repression of PLAP after paternal transmission. Some activity can be seen in the caudal sclerotome. Maternal expression = 98.90. Paternal expression = 22.19. (d) Line DEL24, which does not contain the 1.2-kb silencer, shows minor repression on paternal transmission. Maternal expression = 109.05. Paternal expression = 102.65.
Figure 3
Figure 3
Methylation of transgenes after maternal and paternal transmission. The relative degree of demethylation is quantiatated for all methylation analyses by measuring the intensity of the fully methylated transgene-specific and fully unmethylated bands with Scion Image (except in wild-type control lanes, where the wild-type bands are compared). Values are corrected for copy number of the transgene and expressed as the percentage unmethylated DNA for each lane. (A) Methylation-sensitive CfoI sites in the 4.0-kb region upstream of the H19 gene. The arrow indicates the position of the H19 promoter (gene body not shown). The lollipops above the line represent CfoI sites. Polymorphic restriction sites within the transgenes are marked with an asterisk. The grey box above the line indicates the silencer region that is deleted in the DEL lines. The boxes below the line indicate the HindIII–EcoRI probe HE and the EcoRI–BspEI probe EB. [Restriction enzyme sites are labeled Bsp (BspEI), B (BamHI), H (HindIII), R (EcoRI), and S (SphI).] (B) Distal methylation in the region of the DMD for lines FL16 and FL3. WT indicates wild-type littermate; transgenic littermates are numbered. The plus sign (+) indicates the addition of CfoI. Maternal and paternal transmission of the transgene is indicated by symbols above the lanes. Ten micrograms of DNA from day-13.5 embryos was digested sequentially with SphI and CfoI. The transgene-specific band of 4477 bp is indicated. Imprinted FL16 transgenes show low levels of methylation on maternal transmission and high levels of methylation on paternal transmission. The bi-allelic-expressing FL3 transgenes show the absence of methylation on maternal and paternal transmission. (C) Deletion of the silencer region does not alter parent-specific methylation. DNA from day-13.5 embryos from all four DEL lines was sequentially digested with BamHI/EcoRI and CfoI, and was then probed with EB. The transgene-specific band of 840 bp is indicated; it contains the 5′-most portion of the DMD. The transgenes were predominantly unmethylated on maternal transmission and methylated on paternal transmission. (D) Proximal methylation for line 3.7RF3y. DNA from day-13.5 embryos was digested sequentially with HindIII and the methylation-sensitive enzyme CfoI, and was then probed with HE. The arrows indicate the wild-type HindIII fragment of 4072 bp and the transgene-specific band of 2090 bp. The transgene band is unmethylated on maternal transmission and partially methylated on paternal transmission. (E) Proximal methylation for line MLK16.1 containing −10.5 kb of upstream region. The digest was carried out as described before. The transgene-specific band shows predominate methylation on paternal transmission and less methylation after maternal transmission.

References

    1. Surani M A. Cell. 1998;93:309–312. - PubMed
    1. Reik W, Walter J. Curr Opin Genet Dev. 1998;8:154–164. - PubMed
    1. Ohlsson R, Tycko B, Sapienza C. Trends Genet. 1998;14:435–438. - PubMed
    1. Tilghman S M. Cell. 1999;96:185–193. - PubMed
    1. Brandeis M, Kafri T, Ariel M, Chaillet J R, McCarrey J, Razin A, Cedar H. EMBO J. 1993;12:3669–3677. - PMC - PubMed

Publication types

MeSH terms

LinkOut - more resources