. 1999 Aug 3;96(16):9252-7.
doi: 10.1073/pnas.96.16.9252.

Fine-mapping of quantitative trait loci by identity by descent in outbred populations: application to milk production in dairy cattle

Affiliations

Fine-mapping of quantitative trait loci by identity by descent in outbred populations: application to milk production in dairy cattle

J Riquet et al. Proc Natl Acad Sci U S A. .

Abstract

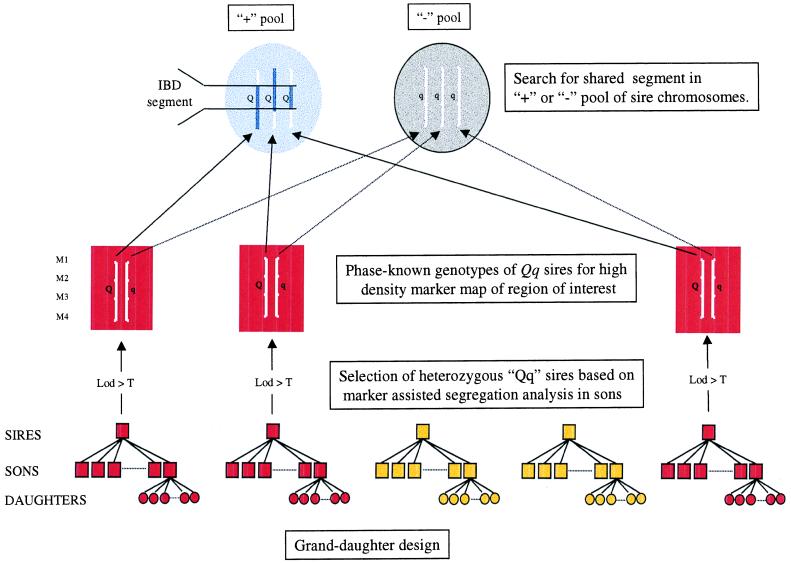
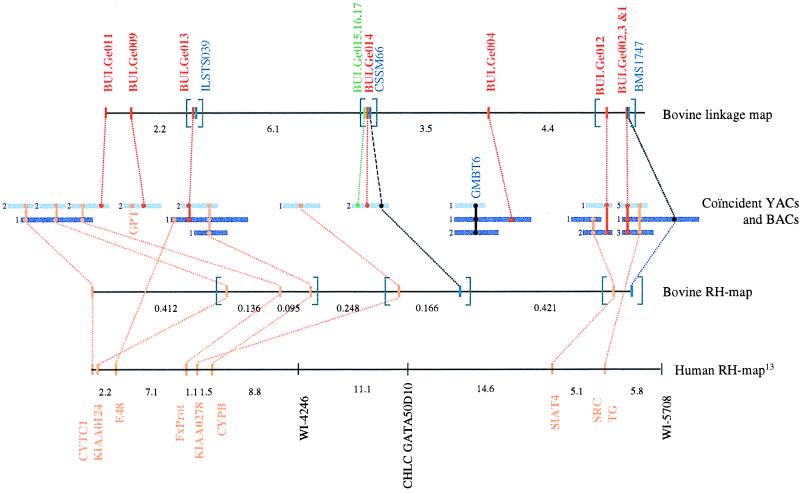
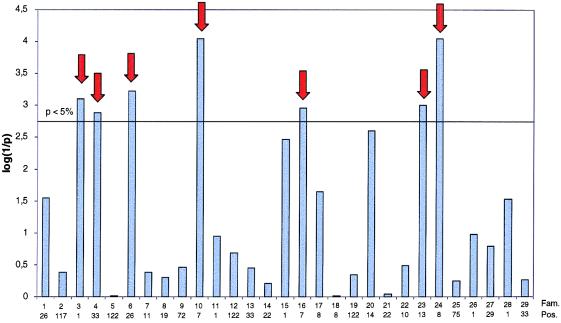
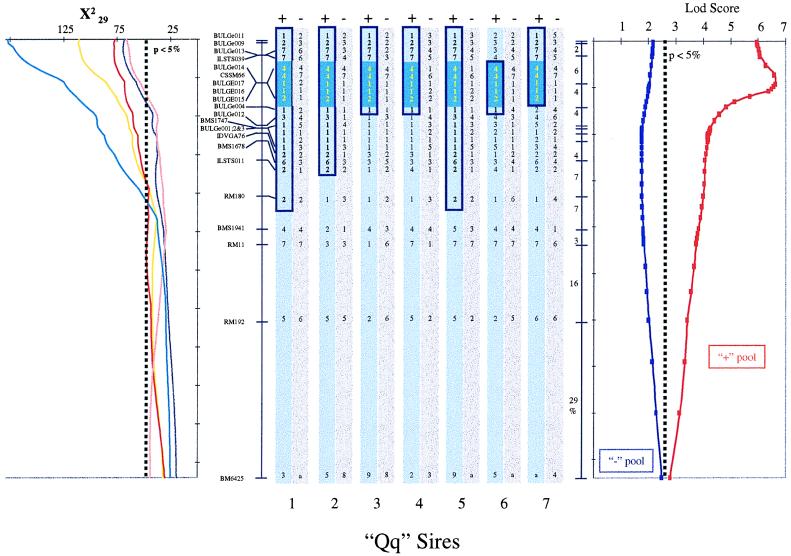
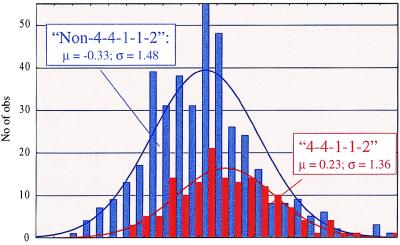
We previously mapped a quantitative trait locus (QTL) affecting milk production to bovine chromosome 14. To refine the map position of this QTL, we have increased the density of the genetic map of BTA14q11-16 by addition of nine microsatellites and three single nucleotide polymorphisms. Fine-mapping of the QTL was accomplished by a two-tiered approach. In the first phase, we identified seven sires heterozygous "Qq" for the QTL by marker-assisted segregation analysis in a Holstein-Friesian pedigree comprising 1,158 individuals. In a second phase, we genotyped the seven selected sires for the newly developed high-density marker map and searched for a shared haplotype flanking an hypothetical, identical-by-descent QTL allele with large substitution effect. The seven chromosomes increasing milk fat percentage were indeed shown to carry a common chromosome segment with an estimated size of 5 cM predicted to contain the studied QTL. The same haplotype was shown to be associated with increased fat percentage in the general population as well, providing additional support in favor of the location of the QTL within the corresponding interval.


Figures

Figure 1
Figure 1
General principles of the proposed IBD fine-mapping method for QTL. In dairy cattle, QTL typically are mapped by using the granddaughter design, i.e., a series of paternal half-brother-ships with phenotypic values corresponding to the sons’ breeding values estimated from the milking performances of their daughters. The proposed approach consists of (i) identifying heterozygous Qq sires (highlighted in red) based on marker-assisted segregation analysis in their respective sons, (ii) genotyping these sires for a high-density marker map in the region of interest and establishing the linkage phase, (iii) sorting the sire chromosomes into two pools according to the associated effect on phenotype, and (iv) identifying a shared haplotype flanking the IBD QTL allele with large substitution effect present in one of the two pools.
Figure 2
Figure 2
Generation of a high-density marker map of BTA14q11–16. CATS were developed from genes positioned on the human RH map corresponding to HSA8q23-ter, shown in orange. The map position of the bovine orthologues was verified by using a hamster-bovine whole-genome RH panel. The corresponding bovine RH map is shown with most likely marker order and centirays between adjacent markers as estimated with rhmap. Marker sets that could not be ordered with odds >1,000 are in brackets. CATS mapping to BTA14q11–16 in cattle were used to screen a bovine YAC and BAC library. Resulting YACs are shown as dark blue bars, while BACs are shown as light blue bars. The numbers shown adjacent to the BAC and YAC clones correspond to the number of clones with identical sequence tagged site content. GMBT6, a variable number of tandem repeat known to map to BTA14q11–16 (29) also was used to screen the YAC and BAC libraries. Microsatellites and SNPs were isolated from the large insert clones as described and used to generate the illustrated linkage map. Most likely marker order and recombination rates between adjacent markers are shown. Marker sets that could not be ordered with odds >1,000 are in brackets. Newly developed microsatellites are shown in red, previously described markers in blue, and SNPs in green.
Figure 3
Figure 3
Maximal log(1/p) values (obtained by chromosome-wide phenotype permutations) for fat percentage in each of the 29 analyzed half-sib families by using a previously described rank-sum approach (7). The experiment-wide significance levels obtained by Bonferroni correction accounting for the analysis of multiple (29) families is shown as a horizontal line. Numbers underneath the bar graph correspond to family number and most likely chromosome position (cM). The selected families are indicated by the red arrows.
Figure 4
Figure 4
Identification of a shared haplotype in the + pool of Qq sire chromosomes. The graph on the left shows the location scores obtained along the marker map of BTA14 for milk yield (yellow line), protein yield (red line), fat yield (purple line), protein percentage (pink line), and fat percentage (blue line) by using the hsqm analysis software (7, 8). The location scores are expressed as χ2 statistics with 29 degrees of freedom. The experiment-wide threshold associated with a type I error of 5% is shown. Order and recombination rates between microsatellite markers and SNPs composing the BTA14 linkage map are given. The vertical bars in the center illustrate the genotypes of the seven postulated Qq sires. The gray bars correspond to the chromosomes of the − pool, while the blue bars correspond to the + pool. The postulated ancestral chromosome carrying the Q QTL allele is boxed in dark blue, while the chromosome segment shared identical-by-state by all seven sires is filled dark blue. The graph on the right illustrates the results obtained with dismult (21), measuring the statistical significance of the haplotype sharing observed in the + and − chromosome pools as a lod score. The experiment-wide threshold associated with a type I error of 5% as obtained by permutation is shown.
Figure 5
Figure 5
Effect of the maternal BULGE14-CSSM66-BULGE17-BULGE16-BULGE15 haplotype on fat percentage. Mean and SD of the DYDs for fat percentage are given for each class.

References

    1. Lander E S, Schork N J. Science. 1994;265:2037–2048. - PubMed
    1. Paterson A H. Genome Res. 1995;5:321–333. - PubMed
    1. Knott S A, Haley C S. Genet Res. 1992;60:139–151.
    1. Darvasi A. Nat Genet. 1998;18:19–24. - PubMed
    1. Schork N J, Cardon L R, Xu X. Trends Genet. 1998;14:266–272. - PubMed

Publication types

LinkOut - more resources