. 1999 Aug 3;96(16):9287-92.
doi: 10.1073/pnas.96.16.9287.

High expression of a specific T-cell receptor gamma transcript in epithelial cells of the prostate

Affiliations

High expression of a specific T-cell receptor gamma transcript in epithelial cells of the prostate

M Essand et al. Proc Natl Acad Sci U S A. .

Abstract

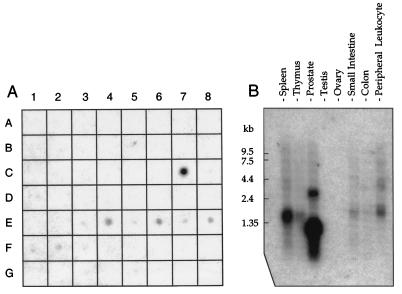
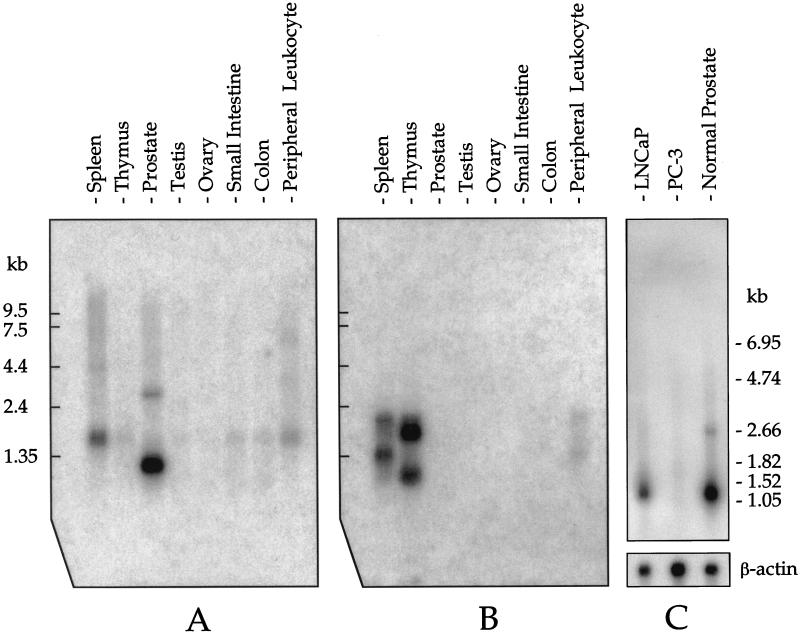
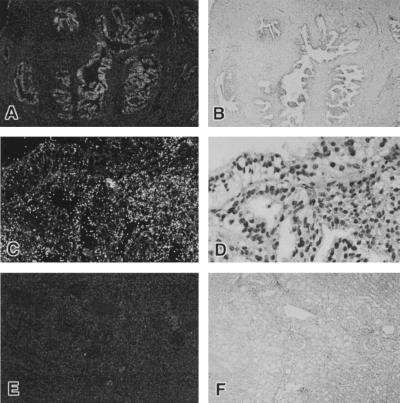
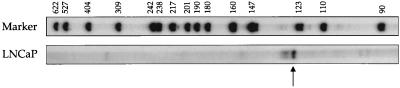
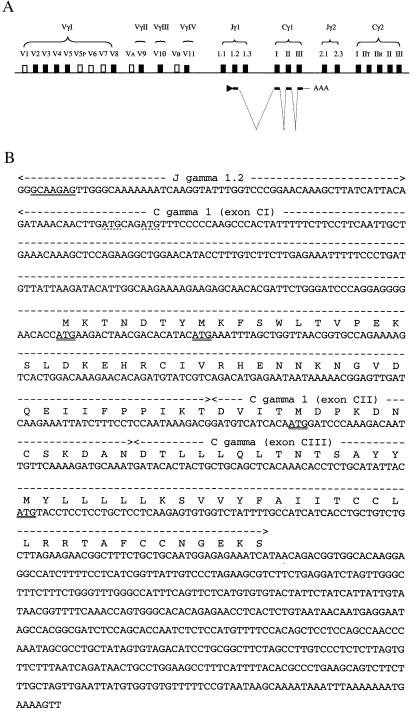
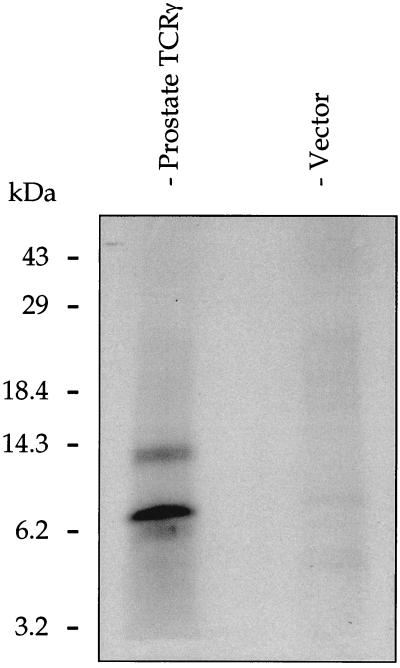
We have identified expression of T-cell receptor gamma chain (TCRgamma) mRNA in human prostate and have shown that it originates from epithelial cells of the prostate and not from infiltrating T-lymphocytes. In contrast, the T-cell receptor delta chain (TCRdelta) gene is silent in human prostate. The major TCRgamma transcript in prostate has a different size than the transcript expressed in thymus, spleen, and blood leukocytes. It is expressed in normal prostate epithelium, adenocarcinoma of the prostate, and the prostatic adenocarcinoma cell line LNCaP. The RNA originates from an unrearranged TCRgamma locus, and it is initiated within the intronic sequence directly upstream of the Jgamma1.2 gene segment. The prostate-specific TCRgamma transcript consists of the Jgamma1.2 and Cgamma1 gene segments, and it has an untranslated sequence including a polyadenylation signal and poly(A) sequence at the 3'end. The finding that prostate epithelial cells express a high level of a transcript from a gene that was thought to by exclusively expressed by T-lymphocytes is highly unexpected.


Figures

Figure 1
Figure 1
Hybridization analysis of TCRγ mRNA expression. (A) Multiple tissue dot blot showing differential expression of human TCRγ. Positive tissues are prostate (C7), small intestine (E3), spleen (E4), thymus (E5), peripheral leukocyte (E6), lymph node (E7), bone marrow (E8), and lung (F2). (B) Northern blot showing TCRγ transcript sizes in normal tissues. Two TCRγ transcripts expressed in prostate are 1.1 and 2.8 kb whereas the predominant transcript in spleen, thymus, and peripheral blood leukocytes is 1.5 kb. The film was exposed for 20 hours.
Figure 2
Figure 2
Northern blot analysis of TCR γδ expression. (A) A TCRγ constant domain (TCR Cγ) cDNA probe shows the 1.1-and 2.8-b prostate-specific transcripts (compare with Fig. 1B). The film was exposed for 20 hours. (B) A TCRδ constant domain (TCR Cδ) cDNA probe reveals that TCRδ mRNA is not expressed in prostate whereas expression is seen in spleen, thymus, and peripheral blood leukocytes. The film was exposed for 50 hours. (C) A TCR Cγ cDNA probe shows that the LNCaP cell line expresses TCRγ whereas the PC-3 cell line does not. The film was exposed for 20 hours. Human β-actin mRNA expression was analyzed as a control.
Figure 3
Figure 3
RNA in situ hybridization on paraffin-embedded tissue sections using a TCRγ (Cγ1–3′UTR) anti-sense, 35S-labeled riboprobe. The left panel photos are from dark field microscopy whereas the corresponding right panel photos are from in bright field microscopy. The bright grains shown in pictures taken in dark field are signals of RNA hybridization. (A) Prostate tissues from a 67-year-old man showing positive acinar epithelial cells and negative stromal cells (×5). (B) Bright field of A. (C) Higher magnification (×40) showing positive areas in the lower right corner. (D) Bright field of C. (E) Kidney tissues showing no RNA hybridization (×5). (F) Bright field of E.
Figure 4
Figure 4
Primer-extension of LNCaP mRNA. The reverse primer anneals in the constant domain of TCRγ, starting 75 nucleotides from the 5′end of Cγ1. The reverse transcription stopped at ≈128 nucleotides, indicated by the arrow, revealing that the transcript is initiated ≈53 nucleotides upstream of Cγ1. The lane with TCRγ reverse transcription of LNCaP was exposed for 72 hours whereas the marker lane was exposed for 8 hours.
Figure 5
Figure 5
The prostate TCRγ transcript. (A) Illustration on how the prostate TCRγ is transcribed and spliced. The transcript consists of a Jγ1.2 segment, the three exons of Cγ1, followed by untranslated sequence. (B) Nucleotide sequence of the TCRγ transcript as obtained from LNCaP cDNA. The starting point of transcription (underlined) is within the 10 first nucleotides of the Jγ1.2 segment. The four translational initiation codons (ATG) in the original TCRγ reading frame are double underlined. The sequence data is available from the European Molecular Biology Laboratory/GenBank/DNA Data Base in Japan under accession no. AF151103.
Figure 6
Figure 6
In vitro transcription-coupled translation analysis of the prostate TCRγ. Two proteins with estimated sizes of 8 and 13 kDa were obtained (lane 1). Negative control reactions using the empty vector (lane 2) did not yield any protein product.

References

    1. Vasmatzis G, Essand M, Brinkmann U, Lee B K, Pastan I. Proc Natl Acad Sci USA. 1998;95:300–304. - PMC - PubMed
    1. Rabbitts T H, Lefranc M-P, Stinson M A, Sims J E, Schroder J, Steinmetz M, Spurr N L, Solomon E, Goodfellow P N. EMBO J. 1985;4:1461–1465. - PMC - PubMed
    1. Bensmana M, Mattei M G, Lefranc M-P. Cytogenet Cell Genet. 1991;56:31–32. - PubMed
    1. Lefranc M-P, Chuchana P, Dariavach P, Nguyen C, Huck S, Brockly F, Jordan B, Lefranc G. Eur J Immunol. 1989;19:989–994. - PubMed
    1. Lefranc M-P, Rabbitts T H. Res Immunol. 1990;141:565–577. - PubMed

Publication types

Substances

Associated data

LinkOut - more resources