. 1999 Aug 3;96(16):9403-8.
doi: 10.1073/pnas.96.16.9403.

Linear coupling between cerebral blood flow and oxygen consumption in activated human cortex

Affiliations

Linear coupling between cerebral blood flow and oxygen consumption in activated human cortex

R D Hoge et al. Proc Natl Acad Sci U S A. .

Abstract

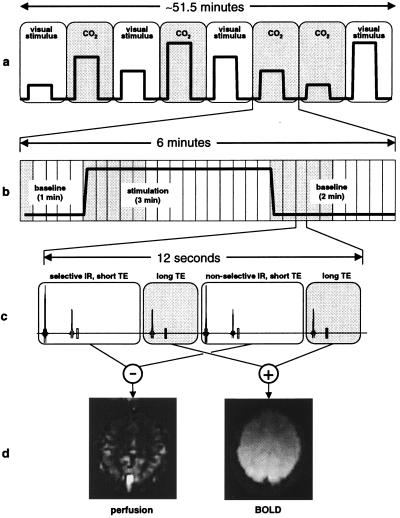
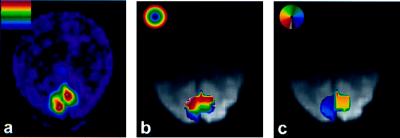
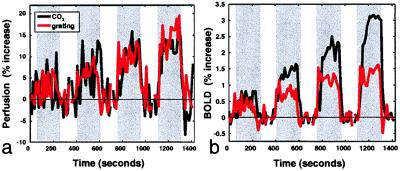
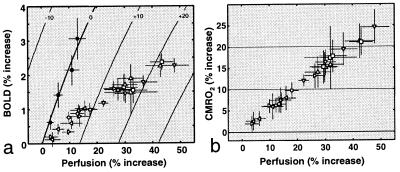
The aim of this study was to test the hypothesis that, within a specific cortical unit, fractional changes in cerebral blood flow (CBF) and cerebral metabolic rate of oxygen consumption (CMR(O(2))) are coupled through an invariant relationship during physiological stimulation. This aim was achieved by simultaneously measuring relative changes in these quantities in human primary visual cortex (V1) during graded stimulation with patterns designed to selectively activate different populations of V1 neurons. Primary visual cortex was delineated individually in each subject by using phase-encoded retinotopic mapping. Flow-sensitive alternating inversion recovery MRI, in conjunction with blood oxygenation-sensitive MRI and hypercapnic calibration, was used to monitor CBF and CMR(O(2)). The stimuli used included (i) diffuse isoluminant chromatic displays; (ii) high spatial-frequency achromatic luminance gratings; and (iii) radial checkerboard patterns containing both color and luminance contrast modulated at different temporal rates. Perfusion responses to each pattern were graded by varying luminance and/or color modulation amplitudes. For all stimulus types, fractional changes in blood flow and oxygen uptake were found to be linearly coupled in a consistent ratio of approximately 2:1. The most potent stimulus produced CBF and CMR(O(2)) increases of 48 +/- 5% and 25 +/- 4%, respectively, with no evidence of a plateau for oxygen consumption. Estimation of aerobic ATP yields from the observed CMR(O(2)) increases and comparison with the maximum possible anaerobic ATP contribution indicate that elevated energy demands during brain activation are met largely through oxidative metabolism.


Figures

Figure 1
Figure 1
Outline of approach used for simultaneous measurement of BOLD and perfusion signals during graded visual stimulation and hypercapnia. (a) Timeline of experimental session, comprising eight scanning runs. Graded stimulus levels, in random order, for different runs are indicated by the variable-height square pulses. (b) Timeline of a single scanning run within a session. A single cycle of stimulation was performed in each run, denoted by the square pulse. Each run resulted in the acquisition of 30 BOLD/perfusion image pairs (rectangular blocks). Image pairs shaded in grey were excluded from calculations of steady-state percent change. (c) Interleaved MRI pulse sequence used to acquire BOLD/perfusion image pairs. Scans 1 and 3 (white blocks) constitute a FAIR acquisition, whereas scans 2 and 4 (grey blocks) are T2*two-weighted (long echo time) acquisitions that are added to produce a single BOLD image overlapping in time with the perfusion image. (d) Examples of perfusion and BOLD images for a single subject acquired simultaneously by using the interleaved pulse sequence.
Figure 2
Figure 2
Example of resampled retinotopic mapping data, used for restriction of spatial averages, from a single subject. (a) Normalized Fast Fourier Transform modulus map showing retinotopic responses at the fundamental frequency at which an annular visual stimulus was periodically swept in the radial direction during BOLD fMRI scanning (three periods in 6 min). (b) Map of visual field eccentricity in retinotopically organized areas, interpolated onto BOLD image acquired with interleaved sequence in a subsequent session. Only the region receiving input from 5 to 10° (≈green → yellow, inclusive, in eccentricity map) in each subject was included in percent change calculations. (c) Polar angle map for the same subject overlaid on BOLD image. Retinotopic representation of the contralateral visual hemifield within the left and right calcarine sulci was a criterion for V1 identification (image left = subject left).
Figure 3
Figure 3
Perfusion and BOLD signals as a function of time during graded hypercapnia and visual stimulation (n = 12; stimulation intervals indicated by grey background). (a) Relative perfusion as a function of time during graded hypercapnia (black curve) and graded visual stimulation (red curve) with contrasts adjusted to match hypercapnia-induced CBF increases. (b) BOLD signal as a function of time during perfusion increases shown in a. BOLD signals during visual stimulation are significantly lower than those observed during hypercapnia at matched perfusion levels, revealing graded increases in oxygen consumption.
Figure 4
Figure 4
Coupling relationships between CBF and CMRO2 during graded visual stimulation. (a) Plot of BOLD vs. perfusion increases (± standard error) during different types of stimulation, with iso-CMRO2 contours at 10% intervals. (b) Relative CMRO2 responses to different stimuli, calculated by using the BOLD-CBF data in a. The data reveal a coupling Δ%CBF:Δ%CMRO2 ratio of ≈2:1.

References

    1. Barinaga M. Science. 1997;276:196–198. - PubMed
    1. Raichle E. Proc Natl Acad Sci USA. 1998;95:765–772. - PMC - PubMed
    1. Brodersen P, Paulson O, Bolwig T. Arch Neurol (Chicago) 1973;28:334–338. - PubMed
    1. Roland P, Eriksson L, Stone-Elander S, Widen L. J Neurosci. 1987;7(8):2373–2389. - PMC - PubMed
    1. Fox P T, Raichle M E, Mintun M A, Dence C. Science. 1988;241:462–464. - PubMed

Publication types