. 1999 Jul 19;190(2):217-28.
doi: 10.1084/jem.190.2.217.

ITM2A is induced during thymocyte selection and T cell activation and causes downregulation of CD8 when overexpressed in CD4(+)CD8(+) double positive thymocytes

Affiliations

ITM2A is induced during thymocyte selection and T cell activation and causes downregulation of CD8 when overexpressed in CD4(+)CD8(+) double positive thymocytes

J Kirchner et al. J Exp Med. .

Abstract

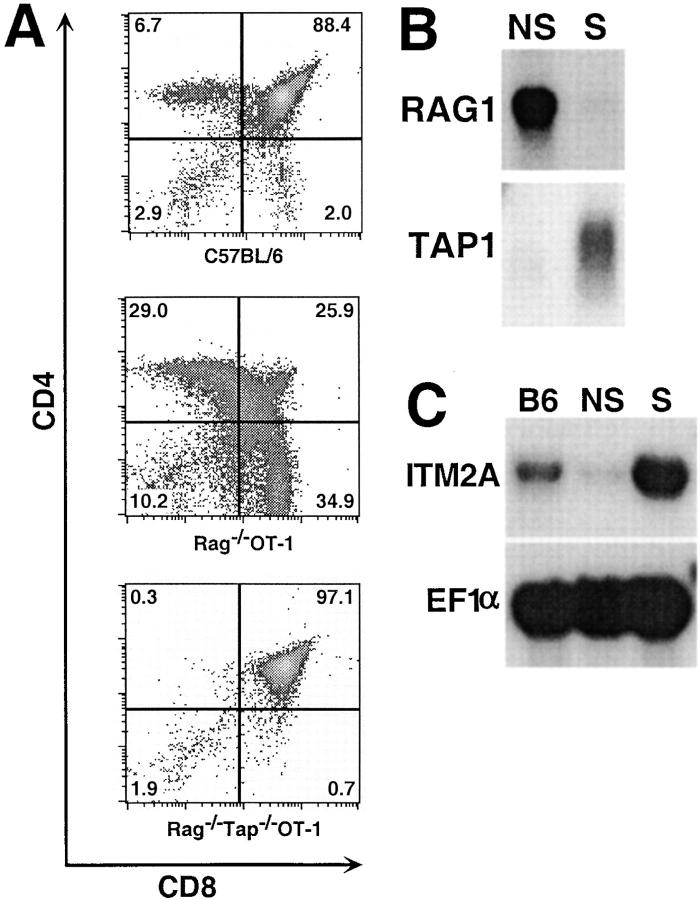
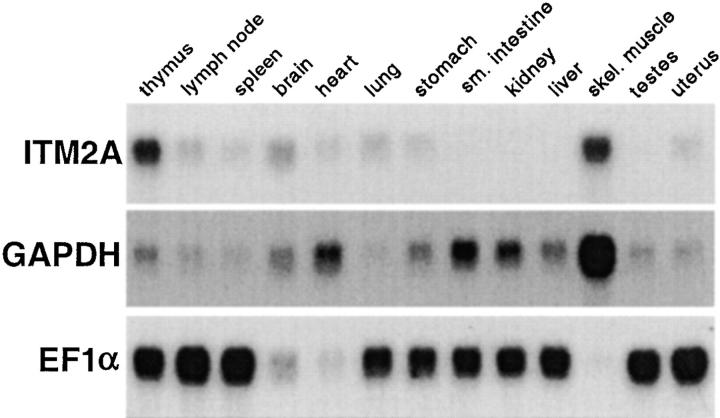
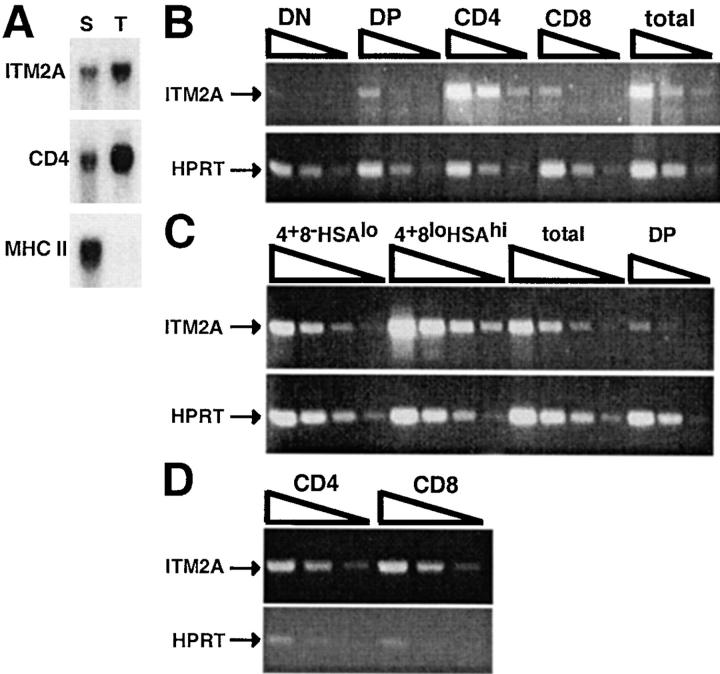
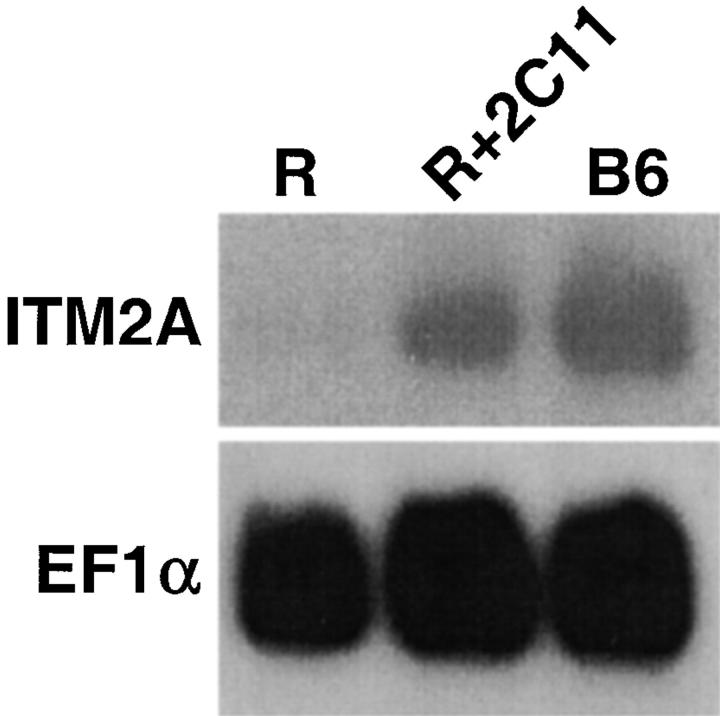
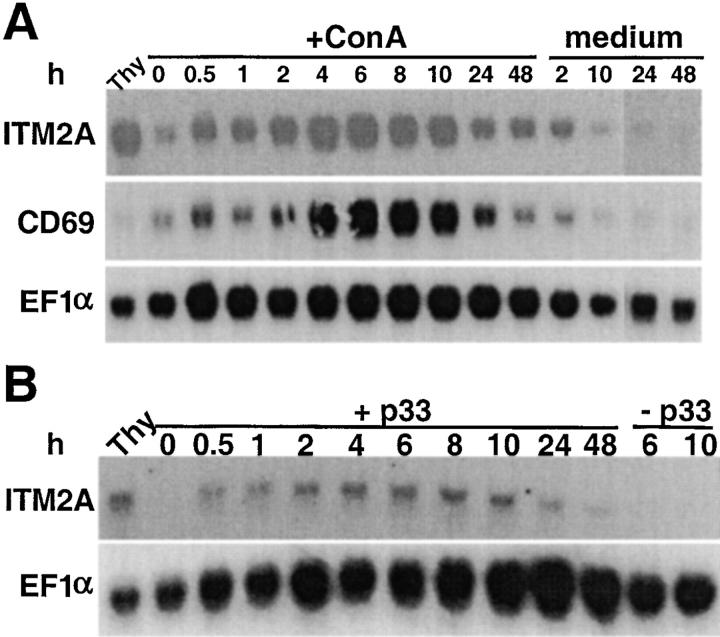
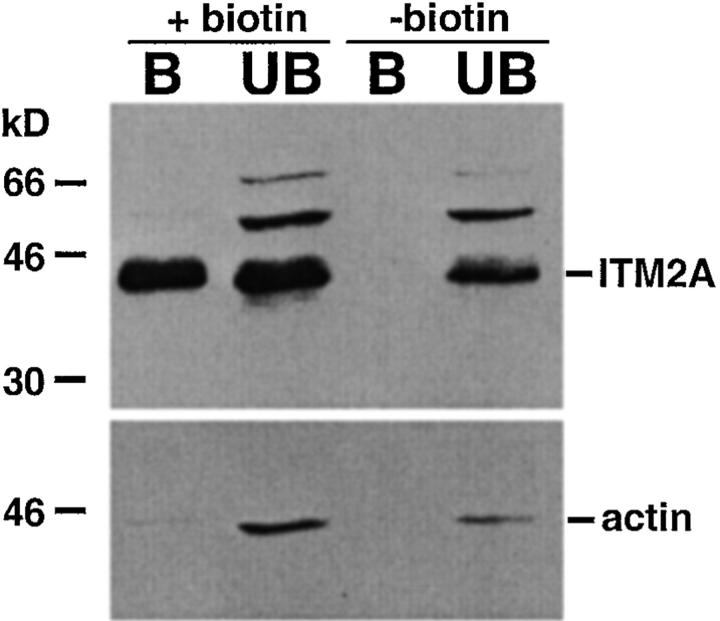
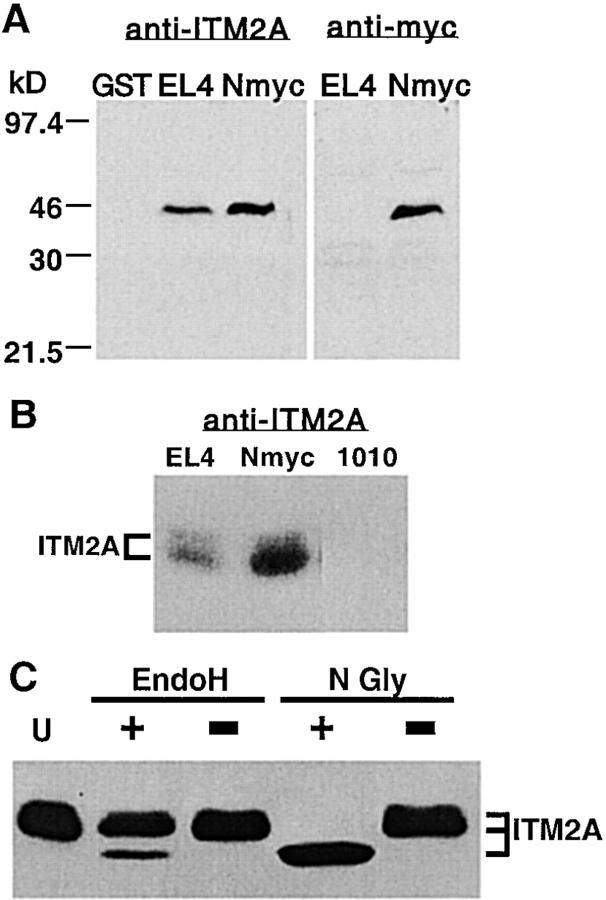
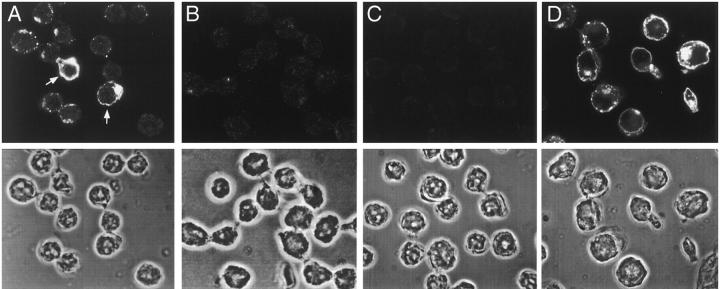
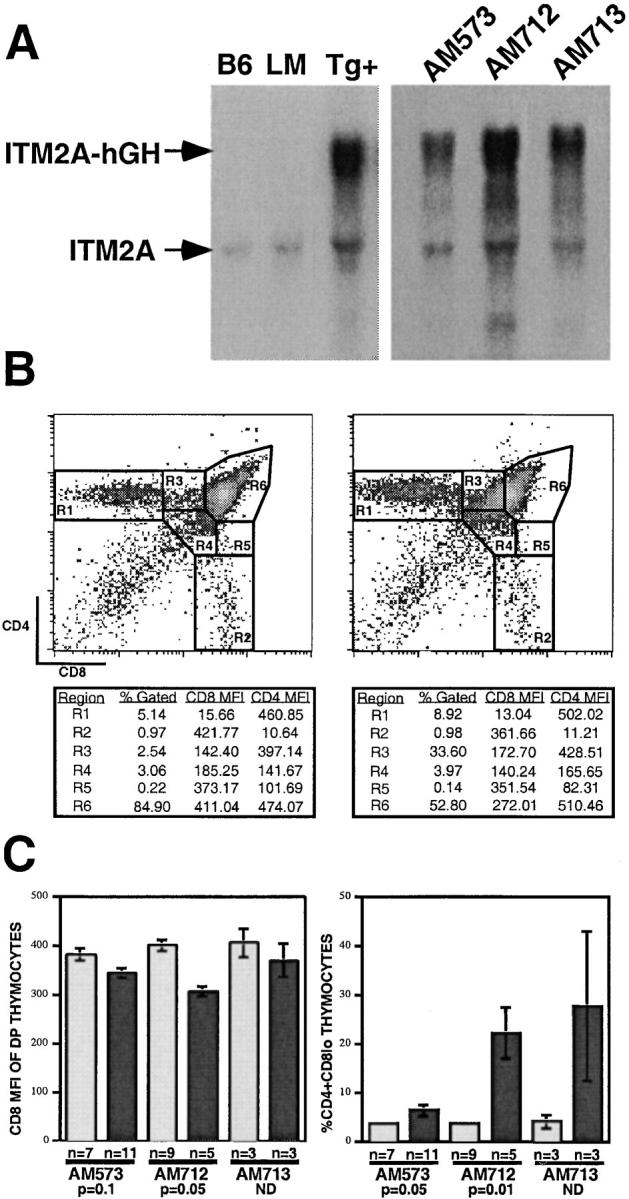
To identify novel genes that are involved in positive selection of thymocytes, we performed polymerase chain reaction (PCR)-based subtractive hybridization between selecting and nonselecting thymi. OT-1 T cell receptor (TCR) transgenic thymocytes on a recombination activating gene (RAG) null background are efficiently selected into the CD8 lineage in H-2(b) mice (RAG-2(-/-)OT-1, selecting thymi), but are not selected on a transporter associated with antigen processing (TAP) null background (RAG-2(-/-)TAP-1(-/-)OT-1, nonselecting thymi). We report here our studies of one gene, ITM2A, whose expression is dramatically higher in T cells in the selecting thymus. The expression pattern of ITM2A in thymocyte subsets correlates with upregulation during positive selection. In addition, ITM2A expression is higher in the thymus than in either the spleen or lymph nodes, but can be upregulated in peripheral T cells upon activation. ITM2A expression was also induced in RAG-2(-/-) thymocytes in vivo upon CD3 cross-linking. We demonstrate that ITM2A is a type II membrane glycoprotein that exists as two species with apparent M(r) of 45 and 43 kD and appears to localize primarily to large cytoplasmic vesicles and the Golgi apparatus, but is also expressed on the cell surface. Expression on the surface of EL4 cells increases with activation by phorbol myristate acetate (PMA) and ionomycin. Finally, overexpression of ITM2A under control of the lck proximal promoter in mice results in partial downregulation of CD8 in CD4(+)CD8(+) double positive (DP) thymocytes, and a corresponding increase in the number of CD4(+)CD8(lo) thymocytes. Possible roles for this novel activation marker in thymocyte development are discussed.


Figures

Figure 1
Figure 1
Identification of ITM2A as a developmentally regulated gene in the thymus. (A) Flow cytometric analysis of thymocytes from C57BL/6, RAG-2−/−OT-1, and RAG-2−/−TAP-1−/−OT-1 mice. The numbers in each quadrant are the percentage of total thymocytes. Northern blot analysis of (B) RAG-1 and TAP-1 expression in a RAG-2−/−TAP-1−/−OT-1 (nonselecting, NS) or RAG-2−/−OT-1 (selecting, S) thymus and (C) ITM2A in a C57BL/6 (B6), nonselecting (NS), or selecting (S) thymus. The blot in C was probed for ITM2A, stripped, and reprobed for EF1α.
Figure 3
Figure 3
Analysis of ITM2A expression in several tissues. 2 μg of mRNA was loaded per lane. The blot was successively hybridized, stripped, and rehybridized with probes for ITM2A and two housekeeping genes, GAPDH and EF1α.
Figure 2
Figure 2
ITM2A expression in thymocyte subsets and peripheral T cells. (A) Northern blot analysis of ITM2A in thymic stromal cells (S) and thymocytes (T). The same blot was stripped and rehybridized with probes for CD4 (thymocyte specific) and MHC class II (I-Ab) (stromal cell specific). (B and C) RT-PCR of sorted thymocyte subsets. Threefold serial dilutions of cDNA representing total thymocytes (total) or one of several subsets were used in PCR with primers for ITM2A. PCR amplification of HPRT was performed to normalize for template amount. The subsets analyzed in B were DN, DP, CD4 SP, and CD8 SP and in C were CD4+CD8HSAlo (4+8HSAlo) and CD4+CD8loHSAhi (4+8loHSAhi) thymocytes. The same DP sample used in B was included in C as a relative standard for comparison. (D) RT-PCR of peripheral CD4 and CD8 T cells. RT-PCR was performed as in B and C on threefold serial dilutions of cDNA from the purified T cells (CD4 and CD8). For the experiments in B, C, and D, purity of the sorted cells was assessed by flow cytometry (data not shown), and PCR was performed on material from two different sorts with similar results.
Figure 5
Figure 5
Northern blot analysis for ITM2A expression in thymocytes from RAG-2−/− mice which were injected with PBS (R), or anti-CD3∈ Ab and harvested 16 h later (R+2C11), and from control C57BL/6 mice (B6). The blot was successively hybridized, stripped, and rehybridized with probes for ITM2A and EF1α.
Figure 4
Figure 4
Northern blot analysis of activated splenocytes. (A) C57BL/6 splenocytes were cultured in medium alone (medium) or supplemented with 5 μg/ml ConA (+ConA). (B) P14 splenocytes were cultured alone (−p33) or in the presence of irradiated EL4 cells coated with p33 peptide (+p33). Total RNA was extracted from cells harvested at various times during activation and from an untreated C57BL/6 thymus (Thy). The blots in A and B were hybridized with probes for ITM2A, EF1α, and CD69 (shown for A only).
Figure 8
Figure 8
ITM2A is expressed on the cell surface. EL4 cells were surface biotinylated (+biotin) or not (−biotin), then lysed. The biotinylated proteins in the cell lysate were precipitated with streptavidin-agarose, and both bound (B) and unbound (UB) fractions were analyzed by immunoblot analysis. Blots were successively probed, stripped, and reprobed with affinity-purified anti-ITM2A antiserum (top panel) and antiactin Ab (bottom panel).
Figure 6
Figure 6
Identification of ITM2A protein. (A) Immunoblot analysis of purified GST and lysates from EL4 cells or EL4 transfected with NmycITM2A. Samples of purified GST (20 ng), EL4 lysate (100 μg), and EL4+ NmycITM2A lysate (100 μg) were run on denaturing 10% polyacrylamide 6-cm gels, transferred to membrane, and used for immunoblot analysis with affinity-purified anti-ITM2A antiserum (left panel) or anti–human c-myc Ab (9E10; right panel). (B) Immunoblot analysis of lysates from EL4, EL4+NmycITM2A (Nmyc), or AKR1010 (1010). 100 μg of each lysate was run on a denaturing 10% polyacrylamide 20-cm gel, transferred to membrane, and used for immunoblot analysis with affinity-purified anti-ITM2A antiserum. (C) Deglycosylation of EL4 lysates. Lysates from EL4 cells were denatured and then treated with EndoH (EndoH +) or N-glycosidase F (N Gly +), incubated in mock reactions (EndoH − and N Gly −, respectively), or left untreated (U).
Figure 7
Figure 7
Subcellular localization of ITM2A. Immunofluorescent microscopy of EL4 cells (A, C, and D) or AKR1010 cells (B) with affinity-purified anti-ITM2A antiserum (A, B, and D) or normal rabbit IgG (C). Cells in D were activated by culturing for 24 h in medium supplemented with 1.2 ng/ml PMA and 250 ng/ml ionomycin. The top panel in each portion of the figure is the fluorescent image, and the bottom panel is the phase image of the same cells.
Figure 9
Figure 9
Expression of ITM2A in transgenic mice under control of the lck proximal promoter. (A) Northern blot analysis of transgene expression. In the left panel, the samples were thymus RNA from C57BL/6 (B6) mice, or transgenic (Tg+) or littermate control (LM) mice from the AM573 founder line. In the right panel, the samples were thymus RNA from progeny of three founder lines: AM573, AM712, and AM713. (B) Flow cytometry analysis of thymocytes from a littermate control (left) and a transgenic mouse (right) of the AM712 founder line. The percentage of total thymocytes (% Gated), CD8 mean fluorescence intensity (MFI), and CD4 MFI for each gated region are shown below each plot. (C) Mean values and SEM are shown for the CD8 MFI of DP thymocytes (R6) (left panel) and the percentage of CD4+CD8lo cells (R3) of total thymocytes (right panel) from littermate control (light gray bars) and transgenic (dark gray bars) mice. The number of mice analyzed (n) is shown below the bar for each group. The significance of the difference between littermate control and transgenic mice is shown for the AM573 and AM712 founder lines (based on the Mann-Whitney U test, reference 42). (The n value for each group in the AM713 founder line was too low to apply this test.)

Similar articles

Cited by

References

    1. Kisielow P., von Boehmer H. Development and selection of T cellsfacts and puzzles. Adv. Immunol. 1995;58:87–209. - PubMed
    1. Jameson S.C., Bevan M.J. T-cell selection. Curr. Opin. Immunol. 1998;10:214–219. - PubMed
    1. Bendelac A., Matzinger P., Seder R.A., Paul W.E., Schwartz R.H. Activation events during thymic selection. J. Exp. Med. 1992;175:731–742. - PMC - PubMed
    1. Brandle D., Muller S., Muller C., Hengartner H., Pircher H. Regulation of RAG-1 and CD69 expression in the thymus during positive and negative selection. Eur. J. Immunol. 1994;24:145–151. - PubMed
    1. Punt J.A., Osborne B.A., Takahama Y., Sharrow S.O., Singer A. Negative selection of CD4+CD8+ thymocytes by T cell receptor–induced apoptosis requires a costimulatory signal that can be provided by CD28. J. Exp. Med. 1994;179:709–713. - PMC - PubMed

Publication types

MeSH terms