. 1999 Aug 15;519 Pt 1(Pt 1):35-45.
doi: 10.1111/j.1469-7793.1999.0035o.x.

The effect of alpha2-delta and other accessory subunits on expression and properties of the calcium channel alpha1G

Affiliations

The effect of alpha2-delta and other accessory subunits on expression and properties of the calcium channel alpha1G

A C Dolphin et al. J Physiol. .

Abstract

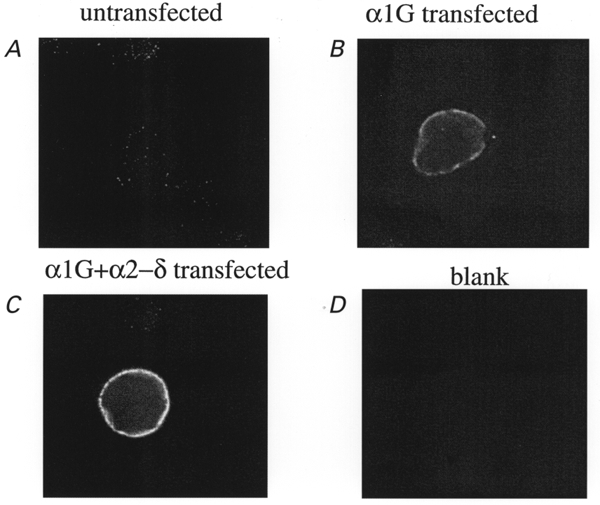
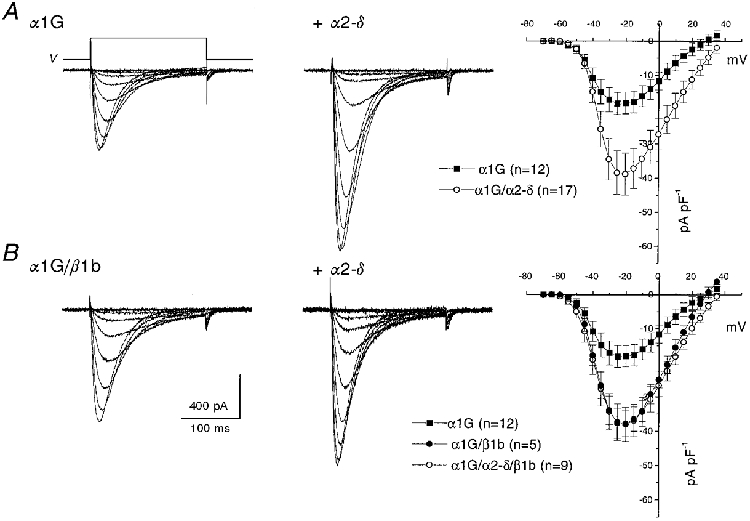
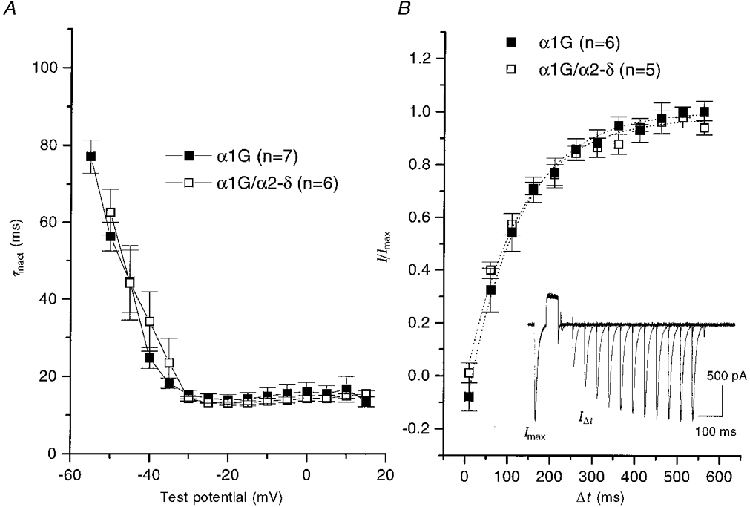
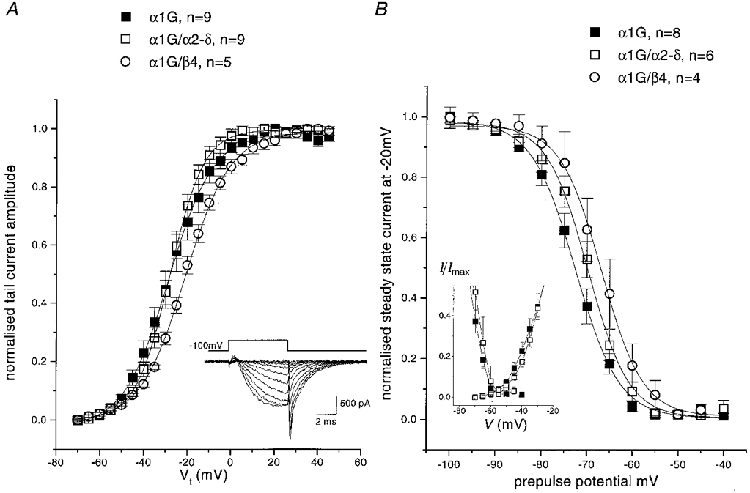
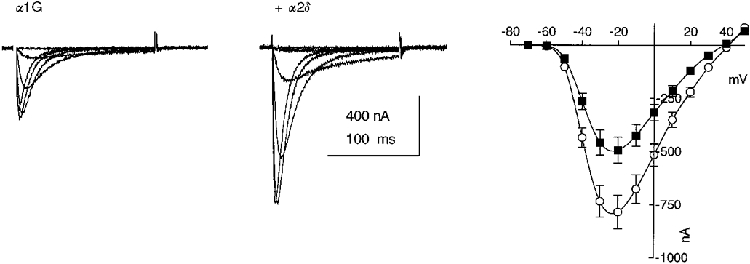
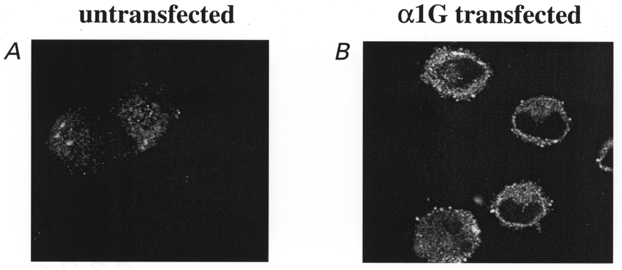
1. The effect has been examined of the accessory alpha2-delta and beta subunits on the properties of alpha1G currents expressed in monkey COS-7 cells and Xenopus oocytes. 2. In immunocytochemical experiments, the co-expression of alpha2-delta increased plasma membrane localization of expressed alpha1G and conversely, the heterologous expression of alpha1G increased immunostaining for endogenous alpha2-delta, suggesting an interaction between the two subunits. 3. Heterologous expression of alpha2-delta together with alpha1G in COS-7 cells increased the amplitude of expressed alpha1G currents by about 2-fold. This finding was confirmed in the Xenopus oocyte expression system. The truncated delta construct did not increase alpha1G current amplitude, or increase its plasma membrane expression. This indicates that it is the exofacial alpha2 domain that is involved in the enhancement by alpha2-delta. 4. Beta1b also produced an increase of functional expression of alpha1G, either in the absence or the presence of heterologously expressed alpha2-delta, whereas the other beta subunits had much smaller effects. 5. None of the accessory subunits had any marked influence on the voltage dependence or kinetics of the expressed alpha1G currents. These results therefore suggest that alpha2-delta and beta1b interact with alpha1G to increase trafficking of, or stabilize, functional alpha1G channels expressed at the plasma membrane.


Figures

Figure 1
Figure 1. Effect of co-expression of α2-δ on immunolocalization of expressed α1G in COS-7 cells
A, α1G immunolocalization in untransfected COS-7 cells; B, α1G immunolocalization in cells transfected with α1G; C, α1G immunolocalization in cells transfected with α1G + α2-δ. D, lack of immunofluorescence in the absence of the primary antibody. Experiments were performed under identical conditions in parallel cultures, and repeated 3 times with similar results. Scale bar, 20 μm.
Figure 2
Figure 2. I-V relationships for α1G and the effect of accessory subunits in COS-7 cells
A shows α1G ± α2-δ and B shows α1G/β1b ± α2-δ. The left and centre panels show representative traces of α1G currents without (left) or with (centre) co-expression of α2-δ. Currents are shown in response to voltage steps (V) from −100 mV to between −70 and −20 mV, in 5 mV steps. The right panels show the corresponding I-V relationships (means ± s.e.m.) for the numbers of experiments given in parentheses.
Figure 3
Figure 3. Inactivation kinetics of α1G currents: effect of accessory α2-δ subunits in COS-7 cells
A, the inactivation phase of individual currents was fitted to a single exponential, and the mean values were plotted for α1G (▪) and α1G/α2-δ (□), for the numbers of experiments given in parentheses. B, recovery from inactivation was determined using the protocol shown in the inset, which depicts 13 overlaid traces obtained at 30 s intervals. The Vh was −100 mV. A 50 ms test step was given to −20 mV (Imax), followed by a 50 ms step to +100 mV to produce complete inactivation, followed by a variable interpulse interval (Δt), and a subsequent identical test step (IΔt). The recovery from inactivation was plotted for α1G (▪) and α1G/α2-δ (□), for the numbers of experiments given in parentheses. The data points were fitted to single exponentials (dotted lines), with τ values of 122.6 ms for α1G and 125.1 ms for α1G/α2-δ.
Figure 4
Figure 4. Voltage dependence of activation and inactivation of α1G currents in COS-7 cells: effect of accessory subunits
A, the current activation plots were determined from tail current amplitudes using the protocol shown in the inset, and normalized to the maximum current. Although this protocol, with a step length of 7.5 ms, gives a small error at low depolarizations because the current is not completely activated, this did not affect the V50 values. Mean ± s.e.m. values are shown for α1G (▪), α1G/α2-δ (□), α1G/β4 (^), with the numbers of experiments shown in the key. For both A and B, the curves are fits to the Boltzmann equation described in the legend to Table 1. B, steady-state inactivation curves were determined by measurement of peak current amplitude at −20 mV, following a 10 s conditioning prepulse to the potentials shown. Data were normalized before averaging the number of experiments given in the key. The symbols are the same as for A. The inset graph shows the region of overlap between the α1G and α1G/α2-δ activation and steady-state inactivation curves.
Figure 5
Figure 5. Effect of α2-δ on α1G expression in Xenopus oocytes
The left and centre panels show representative families of α1G currents recorded at between −60 and −10 mV in Xenopus oocytes in the absence (left) and presence (centre) of heterologously expressed α2-δ. The I-V relationships on the right represent the mean ± s.e.m. values from 40 experiments (10 oocytes from 4 different experiments) for α1G (▪), and α1G + α2δ (^).
Figure 6
Figure 6. Effect of α1G on immunolocalization of endogenous α2-δ in COS-7 cells
A, immunolocalization of endogenous α2 in untransfected COS-7 cells; B, immunolocalization of endogenous α2 in cells transfected with α1G. Experiments were performed under identical conditions in parallel cultures, and transfections were repeated 3 times with similar results.

References

    1. Armstrong CM, Matteson DR. Two distinct populations of calcium channels in a clonal line of pituitary cells. Science. 1985;227:65–67. - PubMed
    1. Berrow NS, Brice NL, Tedder I, Page K, Dolphin AC. Properties of cloned rat α1A calcium channels transiently expressed in the COS-7 cell line. European Journal of Neuroscience. 1997;9:739–748. - PubMed
    1. Brice NL, Berrow NS, Campbell V, Page KM, Brickley K, Tedder I, Dolphin AC. Importance of the different β subunits in the membrane expression of the α1A and α2 calcium channel subunits: studies using a depolarisation-sensitive α1A antibody. European Journal of Neuroscience. 1997;9:749–759. - PubMed
    1. Brickley K, Campbell V, Berrow N, Leach R, Norman RI, Wray D, Dolphin AC, Baldwin S. Use of site-directed antibodies to probe the topography of the α2 subunit of voltage-gated Ca2+ channels. FEBS Letters. 1995;364:129–133. - PubMed
    1. Campbell V, Berrow N, Brickley K, Page K, Wade R, Dolphin AC. Voltage-dependent calcium channel β-subunits in combination with α1 subunits have a GTPase activating effect to promote hydrolysis of GTP by Gαo in rat frontal cortex. FEBS Letters. 1995a;370:135–140. - PubMed

Publication types

LinkOut - more resources