. 1999 Aug;155(2):493-503.
doi: 10.1016/S0002-9440(10)65145-0.

Fibrogenesis and fibrolysis in collagenous colitis. Patterns of procollagen types I and IV, matrix-metalloproteinase-1 and -13, and TIMP-1 gene expression

Affiliations

Fibrogenesis and fibrolysis in collagenous colitis. Patterns of procollagen types I and IV, matrix-metalloproteinase-1 and -13, and TIMP-1 gene expression

U Günther et al. Am J Pathol. 1999 Aug.

Abstract

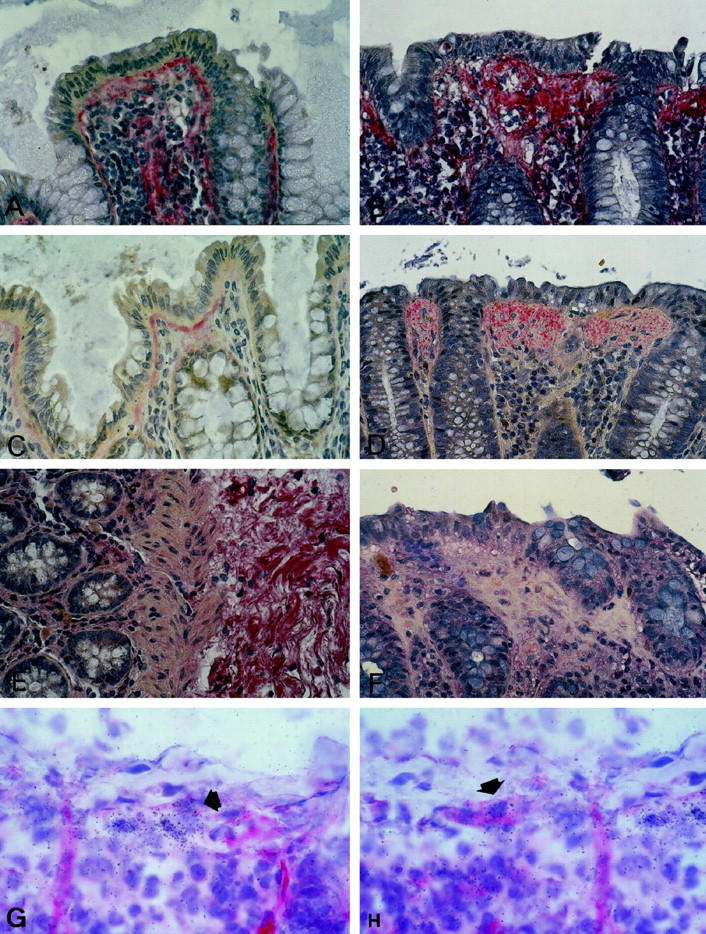
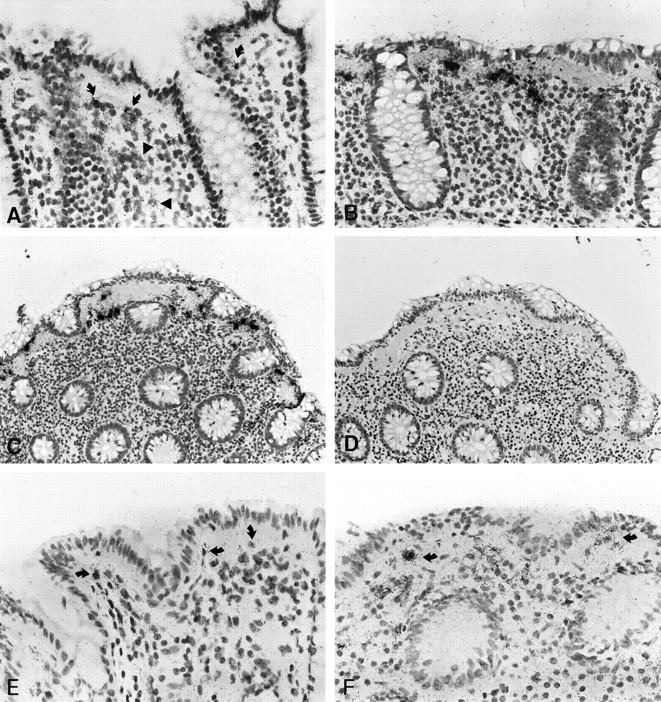
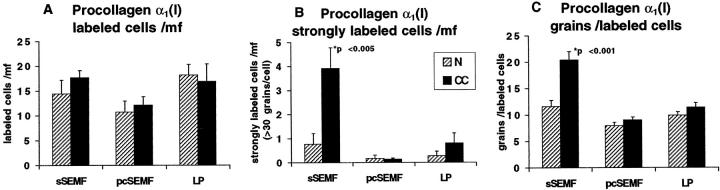
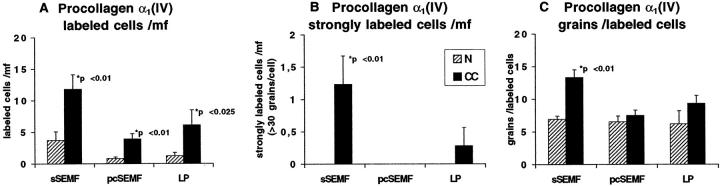
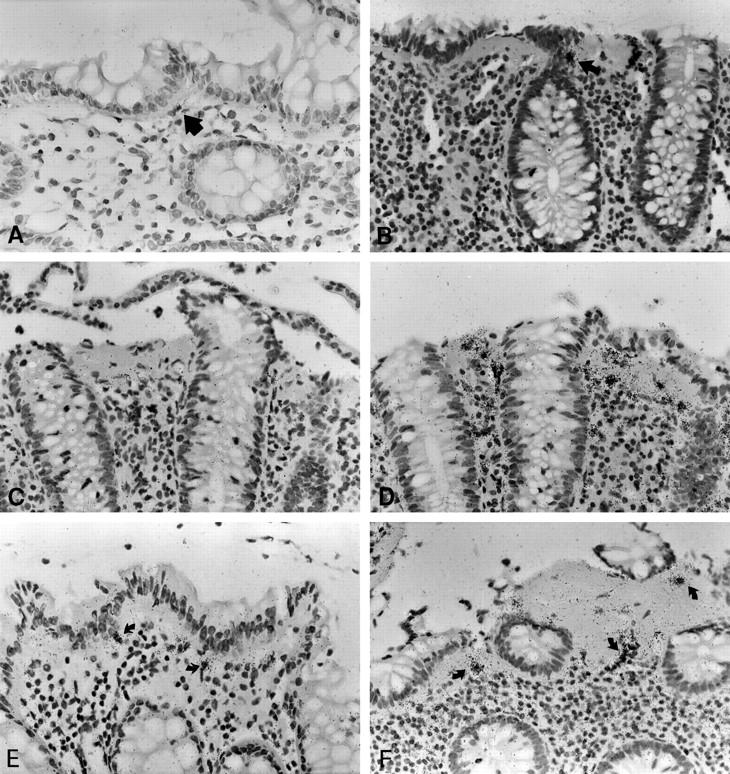
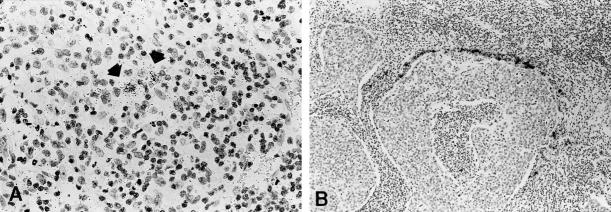
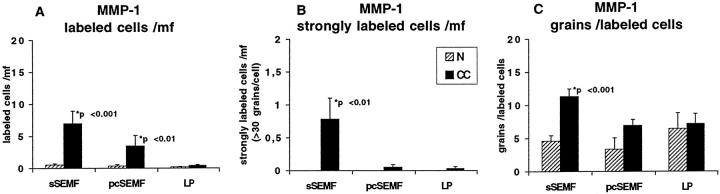
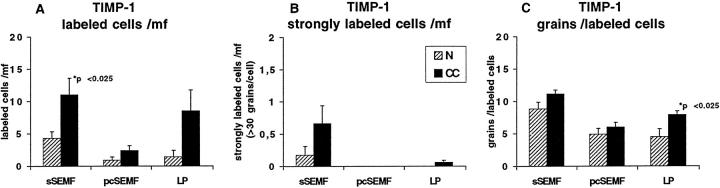
Collagenous colitis is characterized by the deposition of a superficial subepithelial collagenous layer, the pathogenesis of which is unknown. Because the excess matrix deposition is potentially reversible, a labile imbalance between fibrogenesis and fibrolysis may be suspected. Expression of procollagen alpha1(I) and alpha1(IV), matrix-metalloproteinase (MMP)-1 and -13, and tissue inhibitor of metalloproteinase (TIMP)-1 genes was semiquantitated by in situ hybridization on serial biopsies of 12 patients with collagenous colitis and compared to controls. Collagen types I, III, IV, and VI, tenascin, undulin/collagen XIV, and alpha-actin were localized by immunohistology. The superficial collagen layer stained strongly for collagen types I, III, and VI, and particularly for tenascin, but not for undulin. Elevated procollagen alpha1(I), procollagen alpha1(IV), and TIMP-1 transcript levels were found in alpha-actin-positive cells with linear distribution underneath the superficial collagenous layer, whereas MMP-1 RNA expression was variable and restricted to cell clusters. MMP-13 expression was undetectable. The patterns of procollagen alpha1(I)- and alpha1(IV)-specific labeling, combined with an intense tenascin- but absent undulin-specific staining, indicate deposition of an immature interstitial matrix that may be susceptible to degradation. The restricted MMP-1 RNA expression, counteracted by increased TIMP-1 expression, suggests locally impaired fibrolysis as a relevant factor in the pathogenesis of collagenous colitis.


Figures

Figure 1.
Figure 1.
Immunostaining specific for procollagen type III (A, B), tenascin (C, D), and undulin (E, F). Procollagen type III specific staining is present in the lamina propria of normal mucosa, particularly underneath the superficial and crypt epithelium (A), and accumulates in the superficial collagenous layer of CC (B). Tenascin-specific staining is largely localized to a thin subepithelial layer in beneath the surface epithelium of normal colon mucosa (C) and stains the subepithelial matrix deposits of CC in their full thickness (D). Tenascin staining is virtually absent from the pericryptal area in CC and normal mucosa. In normal mucosa, undulin is found in small amounts along vessels in the lamina propria and decorating dense fibrillar bundles of the submucosal stroma (E). At variance with tenascin, undulin is absent from the subepithelial collagenous layer of CC (F). Combined immunohistology and in situ hybridization for smooth-muscle α-actin and procollagen α1(I) RNA in CC (cryostat sections; G, H). A proportion of the procollagen α1(I) RNA-positive cells underneath the superficial collagenous band is decorated by α-actin (arrows, CC case no. 8, Table 1 ▶ ). APAAP technique, original magnification, ×100.
Figure 2.
Figure 2.
Patterns of procollagen α1(I) and α1(IV) expression in normal mucosa and CC as revealed by in situ hybridization with [35S]-labeled RNA probes. B, C, and D represent adjacent serial sections of the same biopsy (case no. 8). Procollagen α1(I)-specific labeling is displayed by cells of the subepithelial myofibroblast sheet (curved arrows) and the lamina propria (arrowheads) of normal colonic mucosa (A). In CC, the same probe reveals cells with high transcripts levels in an almost linear distribution underneath the surface epithelium (B and C). A weak background signal is seen after hybridization with the sense (control) probe (D). As compared to normal mucosa (E), elevated levels of procollagen α1(IV) transcripts are found in myofibroblasts in a linear distribution underneath the surface epithelium in CC (arrows, case no. 6, F). Autoradiographic exposure time 14 days (A–D) and 36 days (E, F). Original magnification, ×100 (A, B, E, F) and ×50 (C, D).
Figure 3.
Figure 3.
Semiquantitative evaluation of autoradiographic signals (silver grains) obtained with the procollagen α1(I) probe in CC cases (closed bars) and in normal mucosa (hatched bars). The histograms represent the average number of all specifically labeled cells (A) and of the strongly labeled cells (>30 grains/cells; B) per microscopic field (mf) in the subepithelial myofibroblast (sSEMF) and pericryptal myofibroblast (pcSEMF) layer and the remainder of the lamina propria (LP). A third panel (C) displays the evaluation of the average number of silver grains per labeled cell. In comparison to normal control mucosa, the number of strongly labeled cells (B) and the average number of grains per labeled cell (C) were significantly increased in the sSEMF sheet of CC biopsies, whereas the relative number of labeled cells did not differ significantly. The evaluation is based on sections of all cases of collagenous colitis (n = 12) and normal controls (n = 7) which had been carried out in parallel through the entire in situ hybridization and autoradiographic procedures.
Figure 4.
Figure 4.
Semiquantitative evaluation of autoradiographic signals (silver grains) obtained with the procollagen α1(IV) probe in CC cases (closed bars) and in normal mucosa (hatched bars) as outlined in Figure 3 ▶ . In CC, the number of cells expressing procollagen α1(IV) transcripts was significantly increased in all compartments of the lamina propria (A). In the sSEMF sheet, the number of strongly labeled cells (B) and the average signal intensity (C) were also significantly higher in CC as compared to normal mucosa.
Figure 5.
Figure 5.
In situ hybridization with MMP-1, procollagen α1(I) and TIMP-1 specific [35S]-labeled RNA probes in normal mucosa and CC. In normal mucosa, MMP-1 expression is restricted to few weakly labeled cells (arrow, A). In CC, MMP-1 labeling is found in few cells clustered within the subepithelial myofibroblast sheet (arrow, B). These foci of expression are interrupted by long stretches of myofibroblasts without detectable MMP-1 RNA transcript levels (B, C). The paucity of these cells is particularly evident when compared to the procollagen α1(I) specific signal on an adjacent serial section (D). TIMP-1 expression is found in a few cells of normal colon (arrows, E), but upregulated in sSEMF, pcSEMF and LP cells of CC specimens (arrows, F). CC cases no. 8 (B, F) and no. 1 (C, D). Autoradiographic exposure time 28 days (A–C), 14 days (D), and 25 days (E, F). Original magnification, ×100 (A–F).
Figure 6.
Figure 6.
In situ hybridization with the MMP-13 specific [35S]-labeled RNA probe in Crohn’s disease and a tonsillar squamous cell carcinoma. A clear autoradiographic signal is seen in few submucosal mesenchymal cells in Crohn’s disease (A), whereas a very intense signal is found in the peritumoral mesenchymal cells in the squamous cell carcinoma (B). Autoradiographic exposure time 36 days. Original magnifications, ×100 (A) and ×40 (B).
Figure 7.
Figure 7.
Semiquantitative evaluation of autoradiographic signals (silver grains) obtained with the MMP-1 probe in CC cases (closed bars) and in normal mucosa (hatched bars) as outlined in Figure 3 ▶ . In comparison to normal control mucosa, the number of MMP-1-expressing cells in general (A) and of cells with high specific transcript levels (B), and the average number of grains per labeled cell is (C) increased in CC. Note that these cells display a clustered distribution (Figure 5) ▶ .
Figure 8.
Figure 8.
Semiquantitative evaluation of autoradiographic signals (silver grains) obtained with the TIMP-1 probe in CC cases (closed bars) and in normal mucosa (hatched bars) as outlined in Figure 3 ▶ . In comparison to normal control mucosa, the number of TIMP-1-expressing cells in general (A) and of cells with high specific transcript levels (B), and the average number of grains per labeled cell (C) is increased in CC. The relative frequency of sSEMF cells with strong MMP-1- and TIMP-1-specific labeling is similar. Note that these cells display a clustered distribution (Figure 5) ▶ .

References

    1. Lindström CG: Collagenous colitis with watery diarrhoea: a new entity? Pathol Eur 1976, 11:87-89 - PubMed
    1. Bogomoletz WV: Collagenous, microscopic and lymphocytic colitis: an evolving concept. Virchows Arch 1994, 424:573-579 - PubMed
    1. Bogomoletz WV, Flejou JF: Newly recognized forms of colitis: collagenous colitis, microscopic (lymphocytic) colitis and lymphoid idiopathic proctitis. Semin Diagn Pathol 1991, 8:178-189 - PubMed
    1. Lee E, Schiller LR, Vendrell D, Santa Ana CA, Fordtran JS: Subepithelial collagen table thickness in colon specimens from patients with microscopic colitis and collagenous colitis. Gastroenterology 1992, 103:1780-1796 - PubMed
    1. Tanaka M, Mazzoleni G, Riddell RH: Distribution of collagenous colitis: utility of flexible sigmoidoscopy. Gut 1992, 33:65-70 - PMC - PubMed

Publication types

MeSH terms