. 1999 Aug;114(2):305-36.
doi: 10.1085/jgp.114.2.305.

Allosteric voltage gating of potassium channels II. Mslo channel gating charge movement in the absence of Ca(2+)

Affiliations

Allosteric voltage gating of potassium channels II. Mslo channel gating charge movement in the absence of Ca(2+)

F T Horrigan et al. J Gen Physiol. 1999 Aug.

Abstract

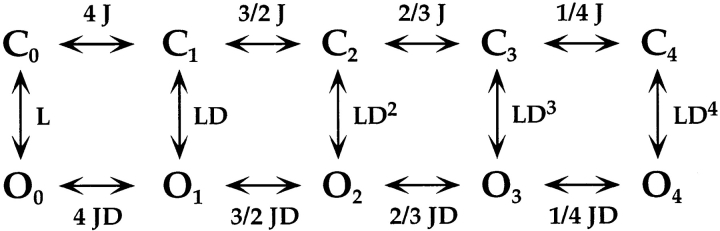
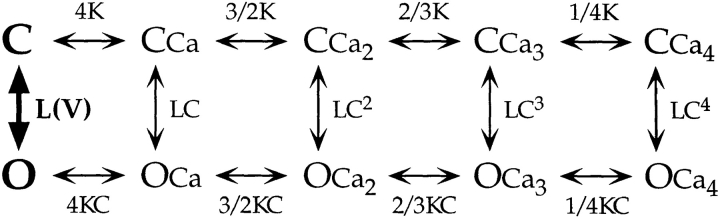
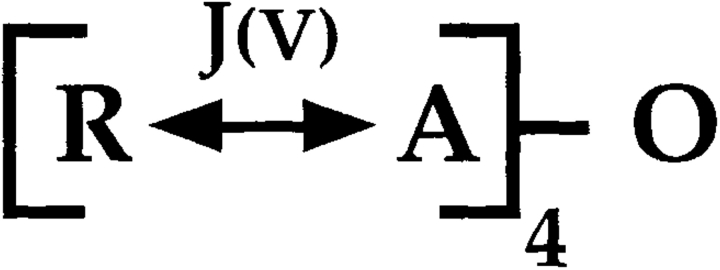
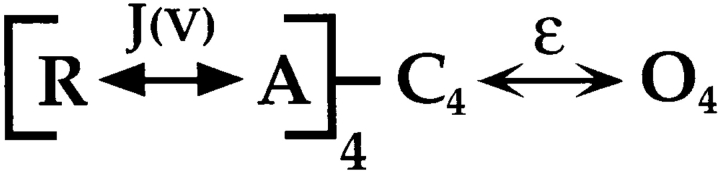
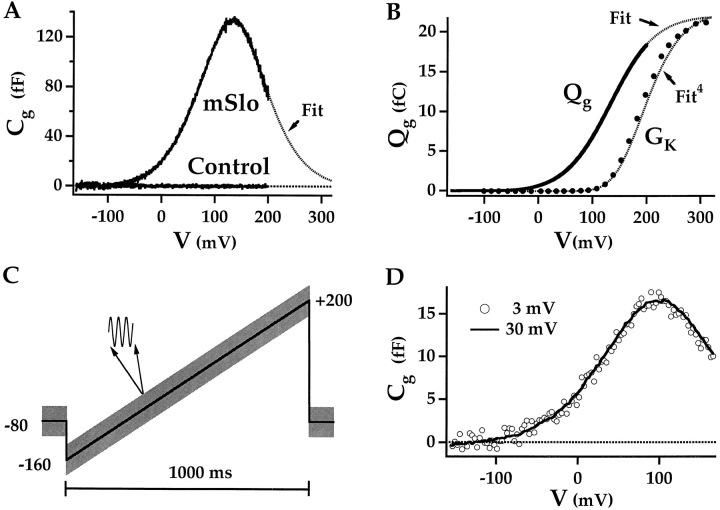
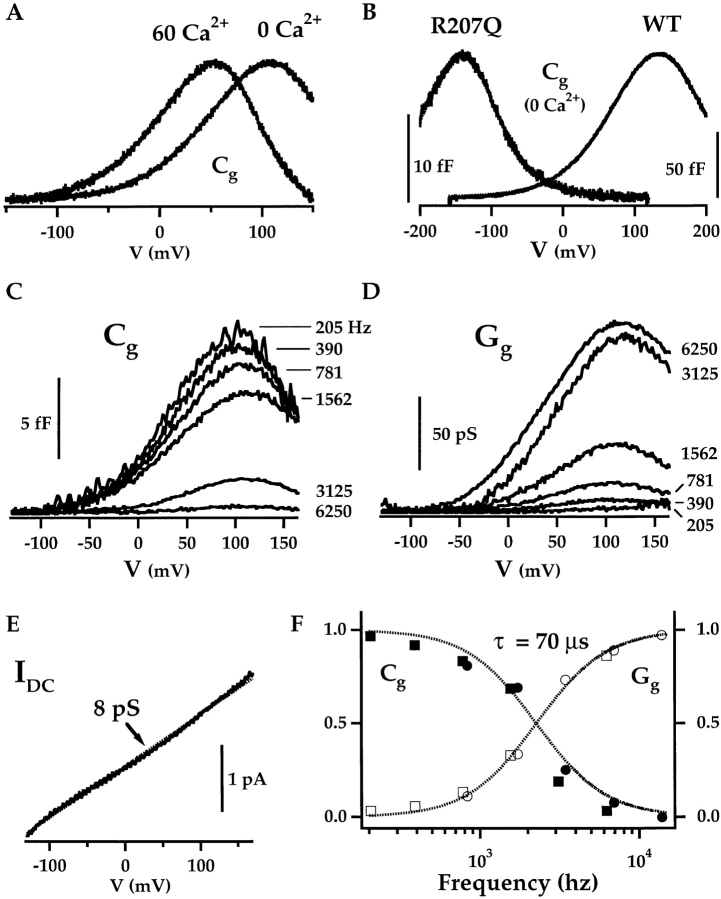
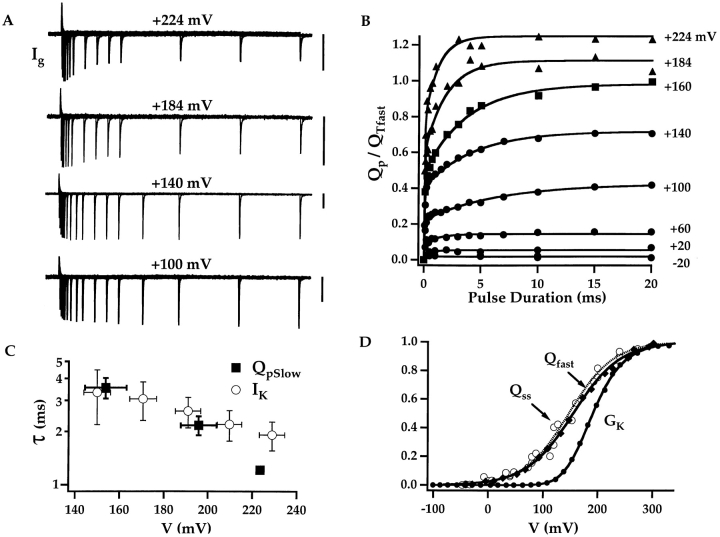
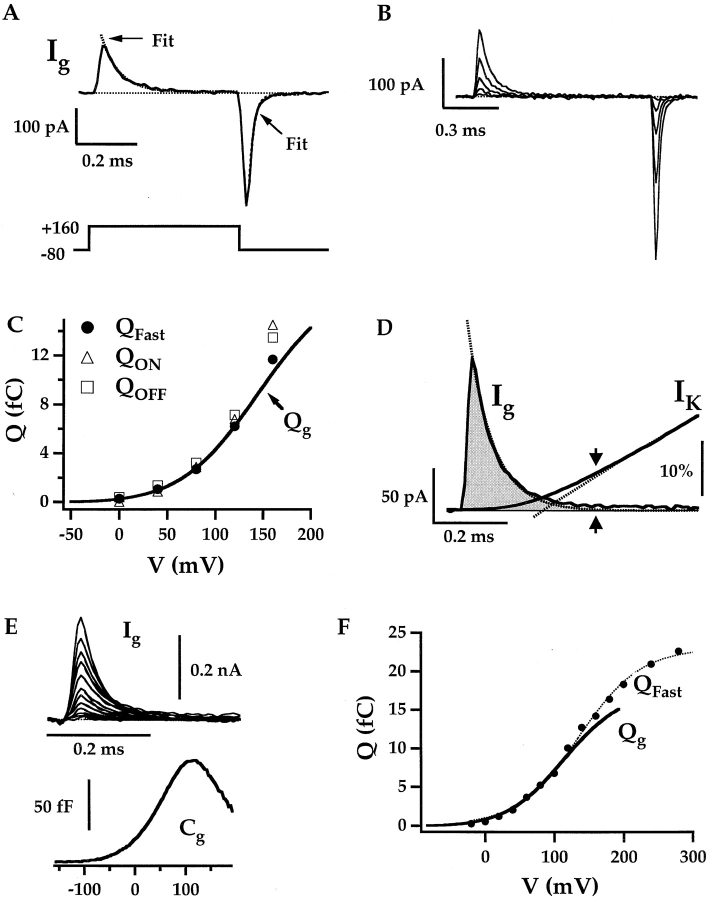
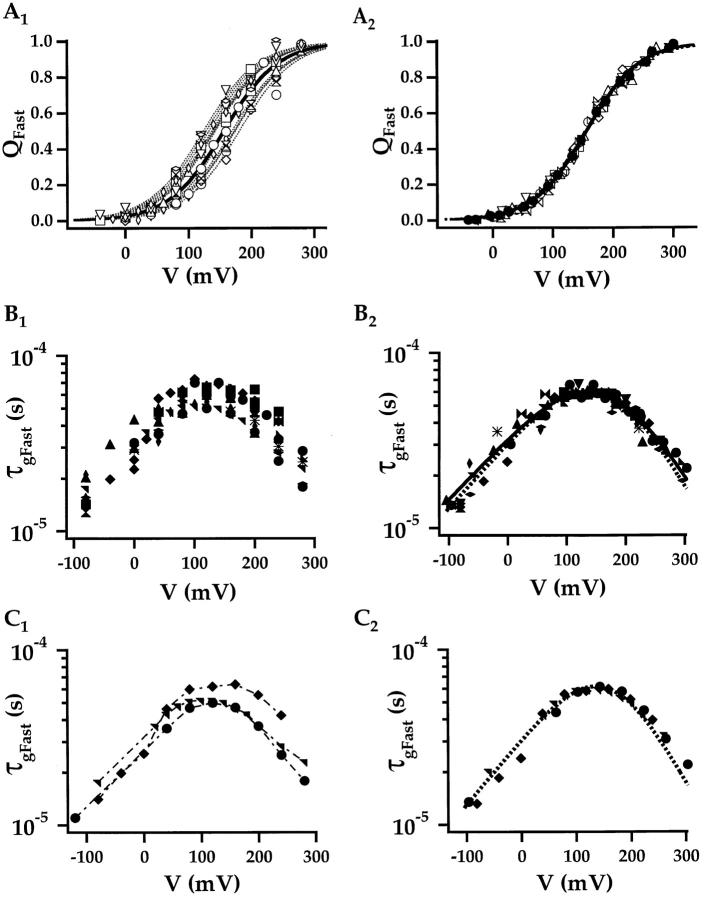
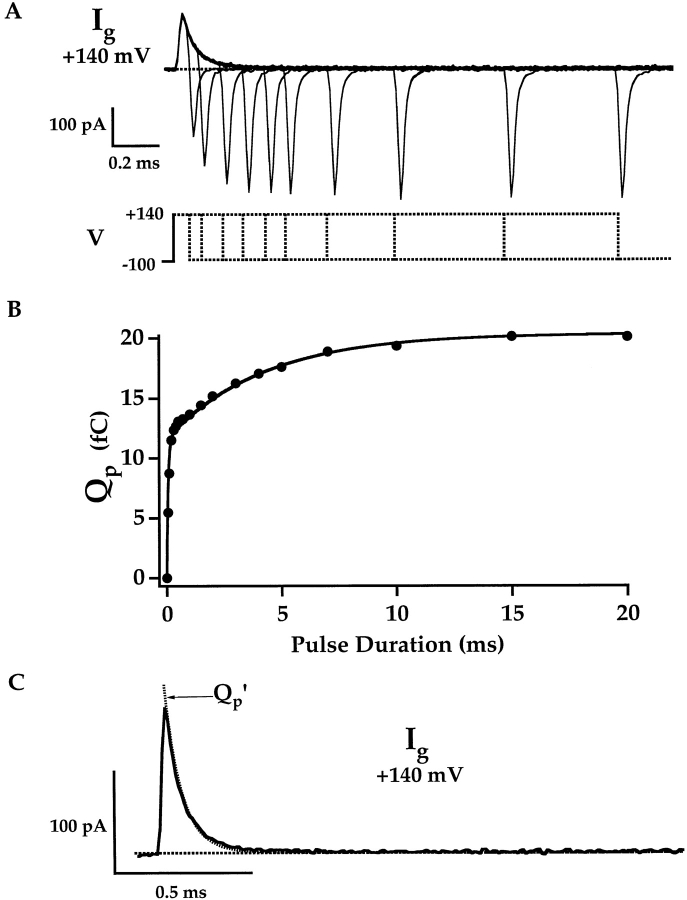
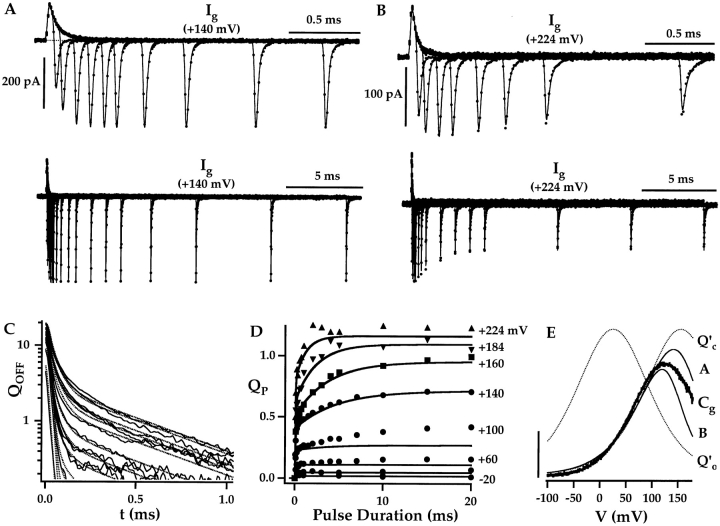
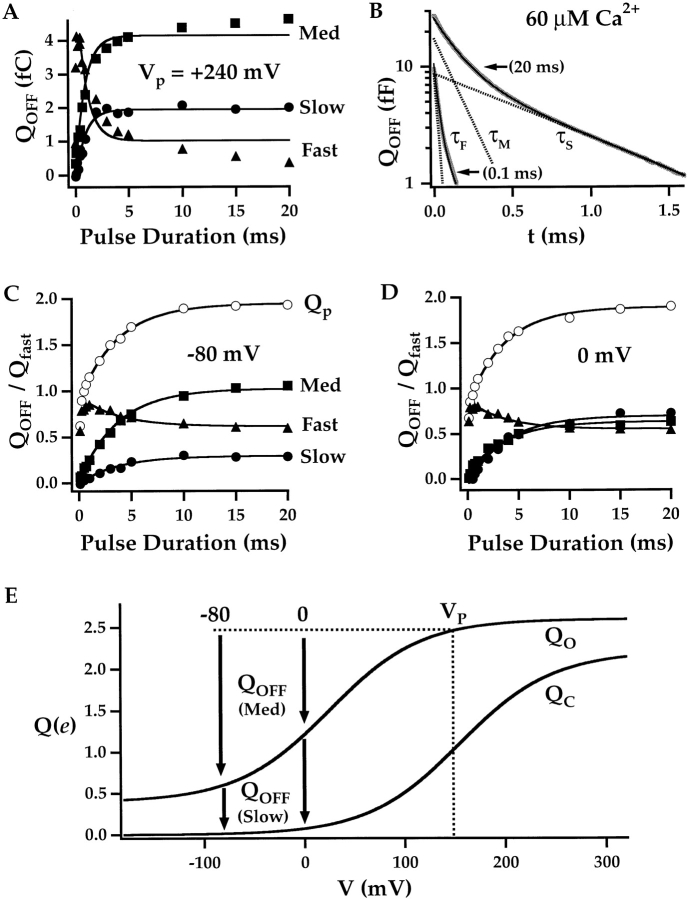
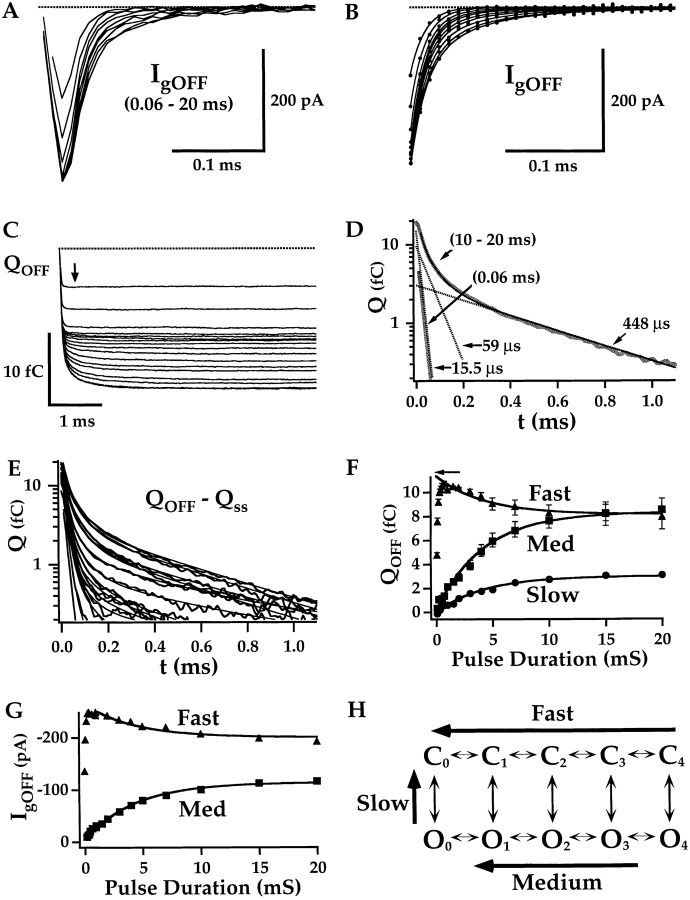
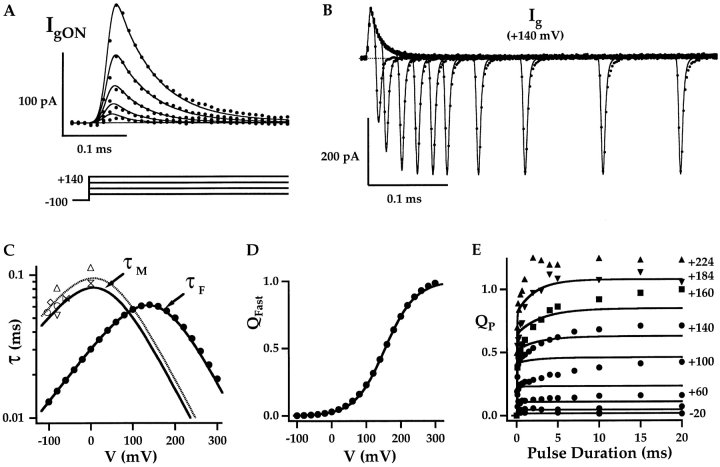
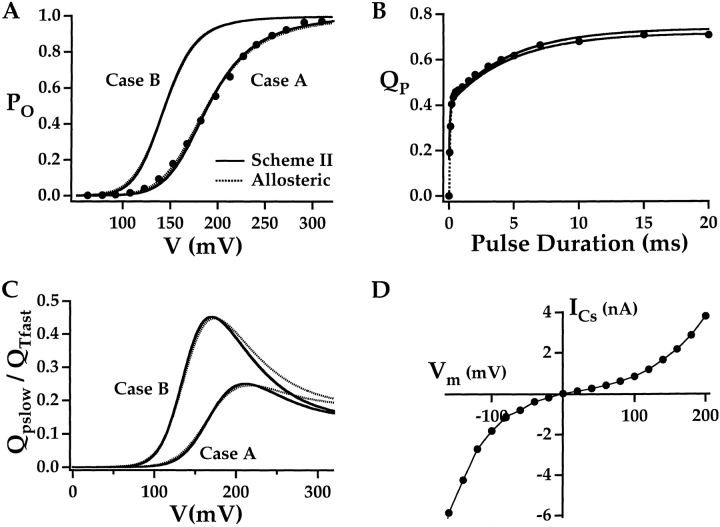
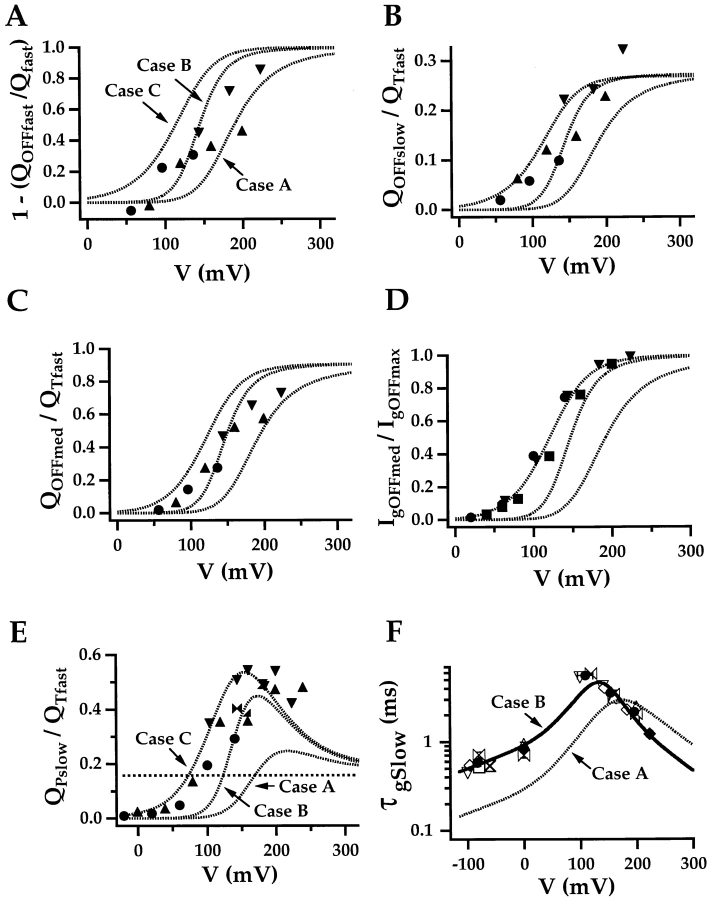
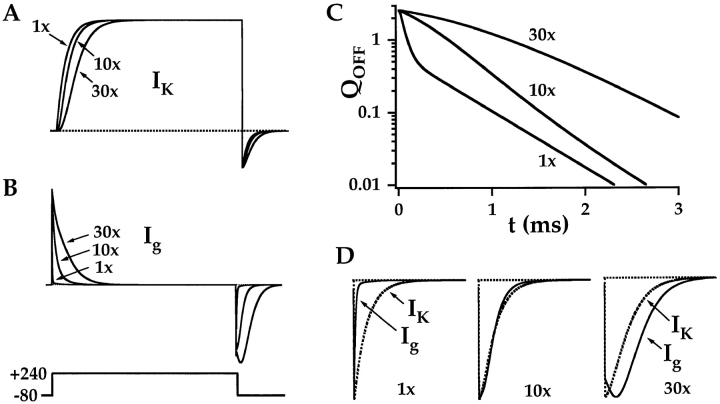
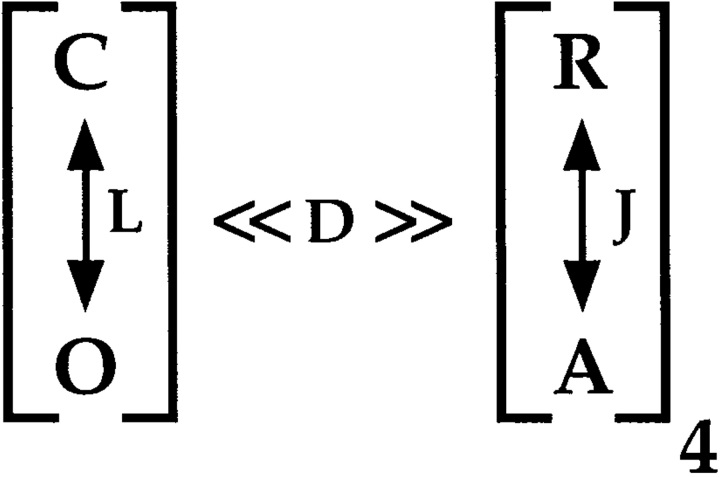
Large-conductance Ca(2+)-activated K(+) channels can be activated by membrane voltage in the absence of Ca(2+) binding, indicating that these channels contain an intrinsic voltage sensor. The properties of this voltage sensor and its relationship to channel activation were examined by studying gating charge movement from mSlo Ca(2+)-activated K(+) channels in the virtual absence of Ca(2+) (<1 nM). Charge movement was measured in response to voltage steps or sinusoidal voltage commands. The charge-voltage relationship (Q-V) is shallower and shifted to more negative voltages than the voltage-dependent open probability (G-V). Both ON and OFF gating currents evoked by brief (0.5-ms) voltage pulses appear to decay rapidly (tau(ON) = 60 microseconds at +200 mV, tau(OFF) = 16 microseconds at -80 mV). However, Q(OFF) increases slowly with pulse duration, indicating that a large fraction of ON charge develops with a time course comparable to that of I(K) activation. The slow onset of this gating charge prevents its detection as a component of I(gON), although it represents approximately 40% of the total charge moved at +140 mV. The decay of I(gOFF) is slowed after depolarizations that open mSlo channels. Yet, the majority of open channel charge relaxation is too rapid to be limited by channel closing. These results can be understood in terms of the allosteric voltage-gating scheme developed in the preceding paper (Horrigan, F.T., J. Cui, and R.W. Aldrich. 1999. J. Gen. Physiol. 114:277-304). The model contains five open (O) and five closed (C) states arranged in parallel, and the kinetic and steady-state properties of mSlo gating currents exhibit multiple components associated with C-C, O-O, and C-O transitions.


Figures

Scheme S1
Scheme S1
Scheme S2
Scheme S2
Scheme S3
Scheme S3
Scheme S4
Scheme S4
Scheme S5
Scheme S5
Figure 1
Figure 1
mSlo gating capacitance. (A) Voltage-dependent membrane capacitance (C g) is plotted versus voltage for patches excised from HEK 293 cells that expressed mSlo channels (mSlo) or were not transfected (control). Each trace represents the average response to two voltage ramps (see panel C). The baseline (C g = 0) was set to the mean of C m between −150 and −100 mV. The C g–V relationship for mSlo is fit by the derivative of a Boltzmann function with respect to voltage (dashed line) with z = 0.59 e and Vh = 133 mV. (B) The Qg–V relationship, determined by integrating the C g–V, is fit by a Boltzmann function. The shape of the average G K–V relationship (symbols; from Horrigan et al. 1999) can be approximated by raising the Qg–V fit to the 4th power (Fit4). (C) The voltage protocol used to measure C g in panel A consists of a 1-s voltage ramp from −160 to +200 mV superimposed with a sinusoidal command (30 mV amplitude, 868 Hz). Capacitance was determined for each period of the sinusoid. (D) C g–V relationships obtained from channels expressed in a Xenopus oocyte using sinusoidal voltage amplitudes of 3 mV (symbols) or 30 mV (solid line) at 1,736 Hz are superimposable, indicating that sinwave amplitude does not effect the measurement. The 3 and 30 mV traces represent the average response to eight and four voltage ramps, respectively. Data are plotted at 3-mV intervals, representing the mean capacitance over eight periods of the sinusoid. The internal solution did not contain crown ether (18C6TA).
Figure 2
Figure 2
C g represents mSlo charge movement. (A) The Ca2+ sensitivity of C g is illustrated by comparing C g–V relationships obtained in 0 or 60 μM [Ca2+]i from the same patch at 868 Hz. Peak C g in 0 Ca was 39% larger than in 60 Ca2+, but traces were normalized to show the shift in the position of peak C g along the voltage axis. (B) C g–V relationships for mSlo wild-type (WT, 1,736 Hz) and mutant (R207Q, 1,500 Hz) channels are similar in shape but are shifted by more than 250 mV relative to each other. Fits, representing the derivative of Boltzmann functions, are superimposed on the data (dashed lines; WT: z = 0.58 e, Vh = 132 mV; R207Q: z = 0.74, Vh = −143 mV). (C) C g–V relationships for wild-type channels decrease in amplitude as the frequency of the sinusoidal voltage command is increased from 200 to 6,944 Hz. (D) The orthogonal component of the admittance signal (G g) increases with frequency. (E) DC current measured during the voltage ramp (see Materials and Methods) changes linearly with voltage, demonstrating that the G signal does not represent voltage-dependent changes in G m and indicating a membrane/seal resistance (125 GV) over the entire voltage range. (F) C g (solid symbols) and G g (open symbols) measured at +120 mV are plotted versus frequency for two experiments and are fit by Lorenzian functions, described in the text, with a time constant of 70 μs.
Figure 6
Figure 6
Slow charge movement is limited by channel activation. (A) Families of I g evoked by pulses of different duration (0.06–20 ms) to the indicated voltages (HP = −80). Records obtained at +184 and +224 mV were from a different patch than those obtained at +100 and +140 mV. Scale bars represent 100 pA. (B) Q p(t) curves at different voltages from three experiments are fit with double-exponential functions where the time constant and amplitude of the fast component were determined by fitting I gON with an exponential function. Plots from different experiments (different symbols) were normalized to the total fast charge (Q Tfast) for each patch (see text). The indicated pulse voltages have been corrected based on the Q–V shifts (ΔVh) determined in Fig. 4 A for each experiment. (C) The time constants of Q pSlow relaxation (τgSlow) (mean ± SD) are plotted versus voltage and compared with the time constants for I K relaxation (mean ± SD) from Horrigan et al., 1999. τgSlow at +224 mV represents a single measurement. (D) Normalized steady-state Q–Vs (open circles) from four experiments were determined with 20-ms pulses and are fit by a Boltzmann function (dashed line, Vh = 143 mV, z = 0.65 e). Q ss–V relationships were corrected for ΔVh determined for these experiments in Fig. 4 A. Averaged Q fast–V and G K–V relationships are plotted for comparison (filled symbols) and are fit by the allosteric voltage-gating scheme (solid lines, z J = 0.55 e, Vh(J) = 155 mV, L = 2 × 10⁻⁶, z L = 0.4 e, D = 17).
Figure 3
Figure 3
mSlo gating current. (A) mSlo I g evoked in response to a 0.5-ms pulse to +160 mV from a holding potential of −80 mV. The trace represents the averaged response to eight pulses. I gON and I gOFF are fit by exponential functions (dashed lines). (B) A family of I g evoked in response to 1-ms pulses to different voltages (0–160 mV in 40-mV steps). (C) Q ON–V and Q OFF–V relationships were obtained by integrating I gON and I gOFF, respectively (from B) over 1-ms intervals. The Q g–V relationship was obtained from C g measurements at 868 Hz in the same patch. Q fast was determined from an exponential fit to I gON (see below). (D) I gON evoked at +160 mV is compared with the initial time course of I K activation measured at the same voltage from a different experiment. I K is fit with an exponential function (dashed line) from 0.5 to 20 ms after the start of the pulse. The I K scale bar represents 10% of the steady-state amplitude. I gON is also fit with an exponential function, and the shaded area under the fit was used to determine Q fast. (E) I gON and C g measured from a single patch were integrated to determine Q fast and Q g, respectively, as plotted in F. The Q fast–V relationship is fit with a Boltzmann function (z = 0.57 e, Vh = 136 mV).
Figure 4
Figure 4
Voltage dependence and kinetics of fast charge movement. (A1) The normalized Q fast–V relationships for many experiments are fit with Boltzmann functions (z = 0.59 e, dashed lines). The solid line is a Boltzmann function indicating the mean half-activation voltage (〈Vh〉 = 155 mV, z = 0.59 e). (A2) The data from A1 (open symbols) are aligned by shifting them along the voltage axis by ΔVh = (〈Vh〉 − Vh). The mean Q fast–V (filled circles, mean ± SEM) is superimposed on the data together with two Boltzmann fits (Vh = 155 mV; solid line: z = 0.59e, dashed line: z = 0.55 e) and was determined by averaging the shifted data in 15-mV bins. (B1) Time constants of fast I g relaxation (τgFast) were determined from exponential fits to ON and OFF currents for the experiments in A and are plotted on a log scale versus voltage. (C1) Three τgFast–V relationships from B1 that cover a large voltage range are compared. (B2 and C2) Data from B1 and C1 were shifted along the voltage axis by ΔVh (determined from A) and then normalized to the mean τgFast measured from +100 to +180 mV (59 μs). The solid line in B2 indicates the best fit of a two-state model of voltage-sensor activation where the relationship between the forward (α) and backward (β) rates are constrained such that J = α/β = 1 at +155 mV (z α = +0.30 e, z β = −0.21 e, α(0) = 1,310 s−1, β(0) = 30,160 s−1). Dashed lines in A2, B2, and C2 represent the parameters ultimately used in the allosteric model to describe closed-state charge movement (z α = +0.33 e, z β = −0.22 e, α(0) = 1,100 s−1, β(0) = 32,120 s−1).
Figure 5
Figure 5
Slow component of gating-charge movement. A family of I g was evoked at +140 mV in response to pulses of different duration (0.06–20 ms). (A) Plots the records for 0.06–2-ms pulse duration. The remaining records are shown in Fig. 6 A. (B) Q OFF was determined by integrating I gOFF for 3 ms after each voltage pulse and is plotted versus pulse duration (Q p). Q p(t) is fit by a double-exponential function with time constants τgFast = 63 μs and τgSlow = 4.22 ms. τgFast was determined by fitting I gON, and Q pFast was set equal to Q fast (11.67 fF) determined as in Fig. 3 D. (C) The time derivative of the fit to Q p(t) (Q p′, dashed line) superimposes on the time course of I gON at +140 mV.
Figure 11
Figure 11
I g Simulations using modified parameters. (A) I g evoked at +140 mV in response to pulses of different duration (HP = −100 mV) are plotted on two different time scales and compared with the predictions of the allosteric scheme using modified parameters corresponding to Case B in Fig. 10 (solid lines, Table : Case B). (B) I g evoked at +224 mV is also fit by the model. (C) Q OFFQ ss corresponding to the records in A are plotted on a semilog scale, demonstrating that the model reproduces all three components of Q OFF. (D) Q p(t) from Fig. 6 B is reproduced by the model (Q ON(t)) for V ≥ +140 mV but the slow component amplitude is underestimated at lower voltages. (E) The C g–V relationship measured from the same patch as in A at 868 Hz is compared with simulations of the allosteric scheme corresponding to Case A and Case B parameters (solid lines). Dashed lines indicate the derivatives of the Q c–V and Q o–V relationships (QC, QO). The scale bar represents 50 fF.
Figure 8
Figure 8
Predictions of the allosteric model. (A) Q OFF component amplitudes determined after pulses to +240 mV in 0 Ca2+ are plotted versus pulse duration. The fast component is reduced to <10% of the total OFF charge after a 20-ms pulse. The relaxation of all three components is fit by exponential functions (solid lines) with a τ = 0.91 ms. (B) The decay of Q OFFQ ss is plotted on a semilog scale after 0.1- or 20-ms pulses to +160 mV in 60 μM Ca2+ (HP = −80). The 0.1-ms trace is fit by a triple exponential function (solid line, τF = 23.8 μs, τM = 150 μs, τS = 822 μs) and the 20-ms trace is fit with a double-exponential (τM = 150 μs, τS = 822 μs), indicating that the fast component is eliminated when most channels are opened. Dashed lines represent the two components of the 20-ms fit and the fast component of the 0.1-ms fit. (C) Normalized Q OFF component amplitudes and total OFF charge (Q p) are plotted versus pulse duration for pulses to +160 mV in 0 Ca2+. OFF components were measured upon repolarization to −80 mV and are normalized to the fast component of ON charge (Q fast) at +160 mV. (D) When Q OFF is measured upon repolarization to 0 mV, the Fast component and Q p are unchanged. However, the Medium component decreases and the Slow component increases in a complementary manner. (E) The charge distributions predicted by the allosteric model for Closed (Q C) and Open channels (Q O) are plotted versus voltage (z J = 0.55 e, Vh(J) = 155 mV, L = 2 × 10⁻⁶, z L = 0.4 e, D = 17). Arrows indicate the predicted amplitudes of Medium and Slow OFF components at repolarization voltages of −80 and 0 mV after a pulse to +160 mV (VP).
Figure 7
Figure 7
Changes in OFF kinetics with channel activation. (A) A family of I gOFF evoked at 2100 mV after pulses to +140 mV of 0.06–20 ms duration (from Fig. 6 A). Current amplitude is maximal after a 0.5-ms pulse, but I gOFF decays more slowly as pulse duration increases. The baseline for each record is set to the mean current during an interval 4–5 ms after the pulse. (B) The decay of OFF currents are fit by double-exponential functions with τF = 15.5 μs and τM = 59 μs. (C) Q OFF obtained by integrating I gOFF from A achieves a steady state within 300 μs after a 0.06-ms pulse (arrow) but relaxes more slowly after longer pulses. (D) The kinetics of Q OFF relaxation after a brief (0.06 ms) or prolonged (10–20 ms) pulses are compared by plotting Q OFFQ ss on a semilog scale. Q ss is the steady-state value of Q OFF measured 3 ms after the pulse. The 0.06-ms trace is fit by a single-exponential function (τF = 15.5 μs). The 10–20-ms trace, representing an average of 10-, 15-, and 20-ms records, is fit by a triple exponential (solid line, τF = 15.5 μs, τM = 59 μs, τS = 448 μs) where the individual components are indicated by dashed lines. (E) A family of Q OFFQ ss for the data in C. Traces are fit with triple exponential functions with the time constants determined from D. (F) Q OFF component amplitudes from these fits are plotted versus pulse duration. The relaxation of all three components is fit by exponential functions (solid lines) with a time constant of 4.22 ms. Error bars represent the component amplitudes obtained when τM is changed by ±10% (with τF and τS held constant). The fast component of ON charge (Q fast) is indicated by an arrow. (G) Fast and Medium I gOFF component amplitudes determined from B are plotted versus pulse duration. Solid lines represent exponential fits with a time constant of 4.22 ms. (H) The allosteric model predicts three components of Q OFF relaxation corresponding to the indicated transitions in the gating scheme.
Figure 9
Figure 9
Simulations of Fast I g. (A) A family of I gON evoked at different voltages (0 to +140 mV) is compared with the prediction of the allosteric scheme (solid lines). Data and simulated traces were both evoked in response to filtered voltage pulses (20 kHz) and then filtered at 20 kHz. (B) A family of gating currents evoked at +140 mV in response to pulses of different duration (from Fig. 5 A) is fit by the allosteric model (solid lines). Model parameters for panels A and B are as shown in Table (Case A) with the exception that α and β were decreased by 2% (α(0) = 1,080 s−1, β(0) = 31,681 s−1) to match this experiment. (C) τgFast measured from simulated traces at different voltages is plotted versus voltage (filled circles) and compared with the τF–V relationship predicted from the parameters assigned to the R–A transition in the model (solid line, τ = 1/(α+β); Case A in Table ). Open symbols indicate the time constant of the Medium OFF component (τM) measured from several patches. Lines through these data represent predictions of the allosteric scheme (see text). (D) The Q fast–V relationship measured from simulated currents (symbols) is compared with the Q C–V relationship specified by the model (line). (E) The time course of Q p predicted by the allosteric model (lines) accounts for the fast component of ON charge but underestimates the magnitude of the slow component.
Figure 12
Figure 12
Predictions of a sequential gating scheme. Predictions of Fig. 4 (dashed lines) are compared with data (symbols) and predictions of the allosteric scheme (solid lines). (A) The G K–V relationship can be fit by either model (except at very low P o [Horrigan et al. 1999]), while assigning identical parameters for voltage-sensor movement (z J = 0.55 e, Vh(J) = 155 mV) and similar charge to the CO transition (z = 0.315 e: Scheme IV; z L = 0.40 e: Allosteric Scheme). Fig. 4 can also approximate the G–V relationship predicted by the allosteric scheme corresponding to Case B by increasing the C–O equilibrium constant (∈(0) = 0.42 Case A; ∈(0) = 4.34 Case B). (B) Both models reproduce the fast and slow components of Qp(t) at +140 mV (from Fig. 5B). Rate constants for the allosteric model correspond to those used in Fig. 11 (Table , Case B). Fig. 4 used the same rates (α, β) and charge (z α, z β) to specify closed-state transitions. The forward and backward rate constants for the C–O transition were δ(0) = 1,392 s−1 and γ(0) = 322 s−1, respectively, and were assumed symmetrically voltage dependent (z δ = +0.158 e, z g = 20.158 e). (C) Both models predict similar bell-shaped Q pSlow–V relationships, implying that a large fraction of slow charge arises from voltage-sensor movement rather than the C–O transitions. (D) The instantaneous I cs–V relationship for mSlo was measured in symmetrical 110 mM Cs+ solutions containing no added K+ by activating channels in response to a 50-ms pulse to +200 mV and then stepping to various voltages. I Cs was measured 100 μs after the pulse to avoid contamination by I gOFF.
Figure 10
Figure 10
Estimating open probability from charge movement. The allosteric model predicts a close relationship between P o and the various Q OFF components. A, B, and C plot the voltage dependence of these components measured after 20-ms pulses for three experiments. Solid lines indicate predictions of three models (Cases A, B, and C) described in the text. (A) The Fast OFF component should be proportional to the number of closed channels at the end of the pulse. Therefore, [1 − [Q OFFfast(VP)/Q fast(VP)] is plotted as an estimate of steady-state P o, where Q fast is the fast component of ON charge. (B) The Slow OFF component should be directly proportional to P o. The quantity (Q OFFslow(VP)/Q Tfast) is plotted where Q Tfast is the total fast charge estimated by fitting the Q fast–V relationship with a Boltzmann function. (C) The Medium OFF component is normalized by Q Tfast and plotted versus voltage. (D) The voltage dependence of the Medium OFF component was also examine by fitting I gOFF with a double-exponential function (τF, τM) and plotting the normalized amplitude of I gOFFmed against voltage. I gOFFmed was normalized by fitting the I gOFF–V relationship with a Boltzmann function corresponding to Case C (z = 0.98 e). (E) The Slow component of ON charge (Q pSlow) is expected to exhibit a complex voltage dependence (dashed curves) that is highly sensitive to P o. The data, normalized by Q Tfast, indicate that the slow component is too large to be accounted for by the initial allosteric model parameters (Case A) but a shift in the P o–V relationship (Cases B and C) produces a better fit. A dashed line indicates the charge assigned to the C–O transition (z L) (F) τgSlow determined from the time course of Q pSlow and Q OFFslow for many experiments are plotted versus voltage. Solid symbols represent mean ± SEM. Dashed and solid lines represent predictions of Case A and B, respectively (Table ).
Figure 13
Figure 13
Voltage-sensor speed and the detection of open-state charge. Ionic and gating currents were simulated in response to a 20-ms pulse to +240 mV (HP = −80 mV) using the allosteric model. Traces labeled 1× were generated using Case B parameters (Table ). 10× and 30× traces indicate the effects of a 10- or 30-fold increase in the time constant of voltage-sensor movement, implemented by decreasing both voltage-sensor rate constants (α, β) and leaving equilibrium constants unchanged. As voltage-sensor movement is slowed (A), the time course of I K activation becomes more sigmoidal. (B) I g is slowed and the OFF current becomes ‘hooked.’ Most channels are open at the end of the pulse, and the relaxation of OFF charge plotted as Q OFF(t)–Q OFFss in C is biphasic when voltage-sensor movement is fast (1×) representing O–O (Medium) and O–C (Slow) transitions. However, open-channel charge movement is not evident as a kinetically distinct component of Q OFF when voltage sensors are slowed (10×, 30×). (D) Similarly, the decay of I gOFF is much faster than I K deactivation when voltage-sensor movement is fast, but I gOFF and I K decay with a similar time constant for 10× and 30× simulations.
None

References

    1. Aggarwal S.K., MacKinnon R. Contribution of the S4 segment to gating charge in the Shaker K+ channel. Neuron. 1996;16:1169–1177. - PubMed
    1. Armstrong C.M. Interaction of tetraethylammonium ion derivatives with the potassium channels of giant axons. J. Gen. Physiol. 1971;58:413–437. - PMC - PubMed
    1. Armstrong C.M., Bezanilla F. Charge movement associated with the opening and closing of the activation gates of the Na channels. J. Gen. Physiol. 1974;63:533–552. - PMC - PubMed
    1. Barrett J.N., Magleby K.L., Pallotta B.S. Properties of single calcium-activated potassium channels in cultured rat muscle. J. Physiol. (Lond.). 1982;331:211–230. - PMC - PubMed
    1. Bezanilla F., Perozo E., Papazian D.M., Stefani E. Molecular basis of gating charge immobilization in Shaker potassium channels. Science. 1991;254:679–683. - PubMed

Publication types

Substances