. 1999 Aug 15;19(16):6855-64.
doi: 10.1523/JNEUROSCI.19-16-06855.1999.

Identification of residues in the N terminus of alpha1B critical for inhibition of the voltage-dependent calcium channel by Gbeta gamma

Affiliations

Identification of residues in the N terminus of alpha1B critical for inhibition of the voltage-dependent calcium channel by Gbeta gamma

C Cantí et al. J Neurosci. .

Abstract

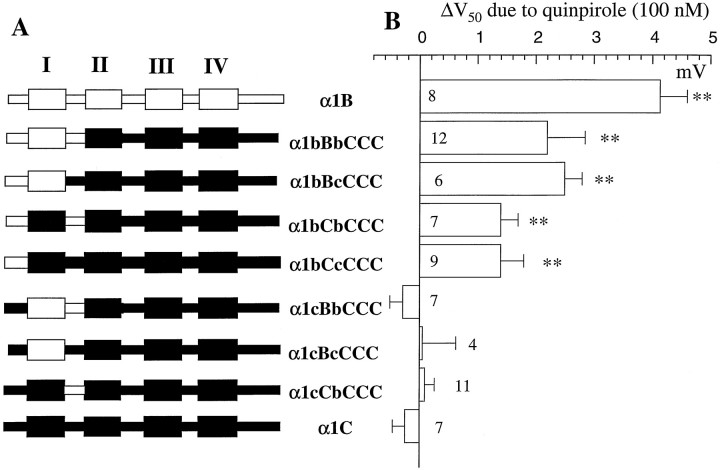
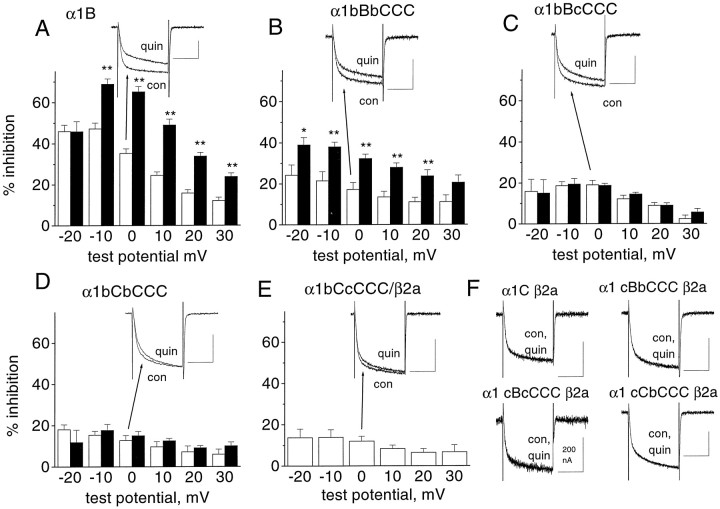
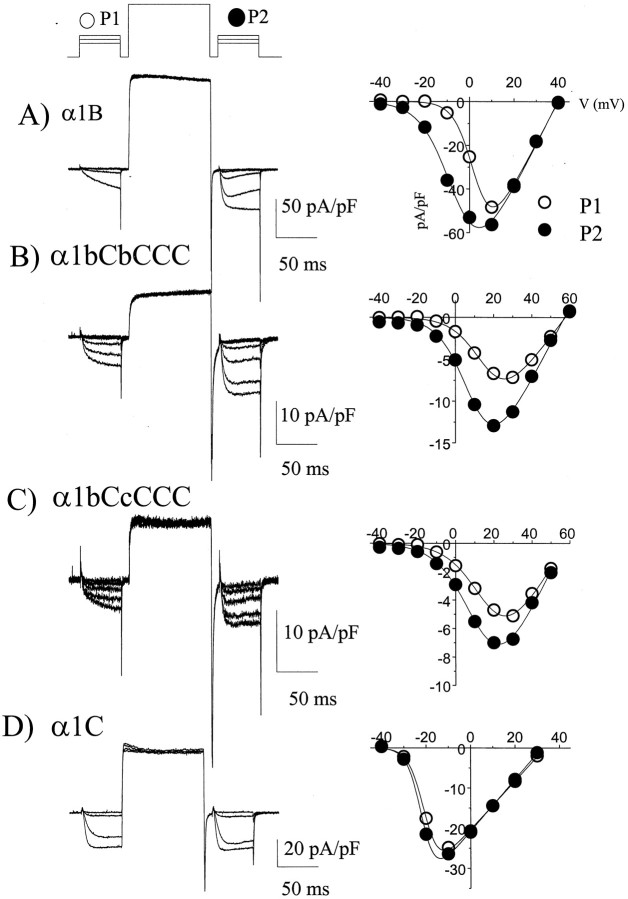
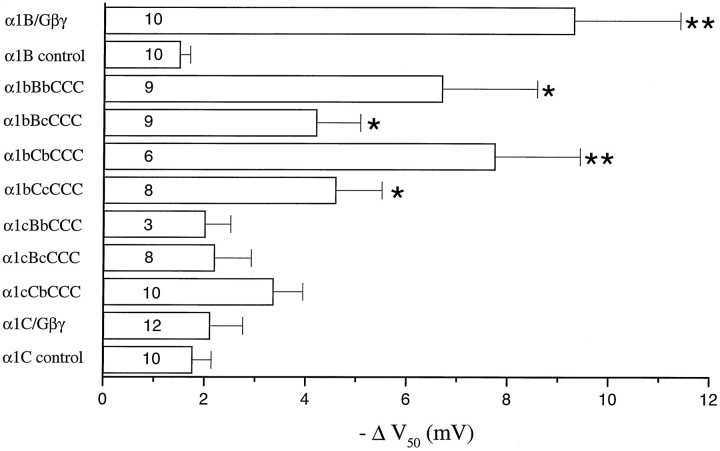
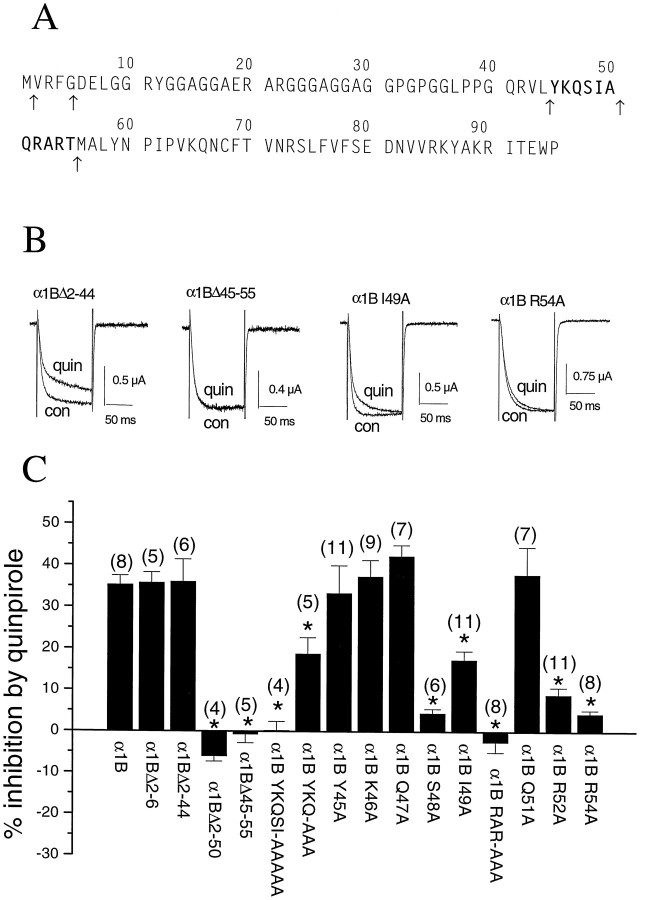
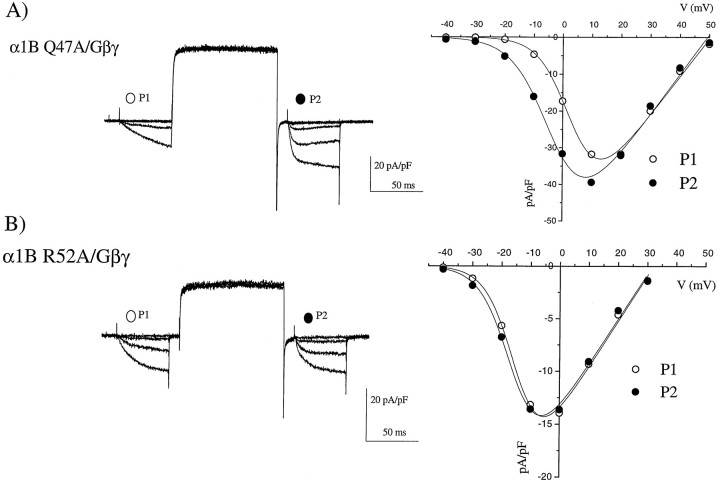
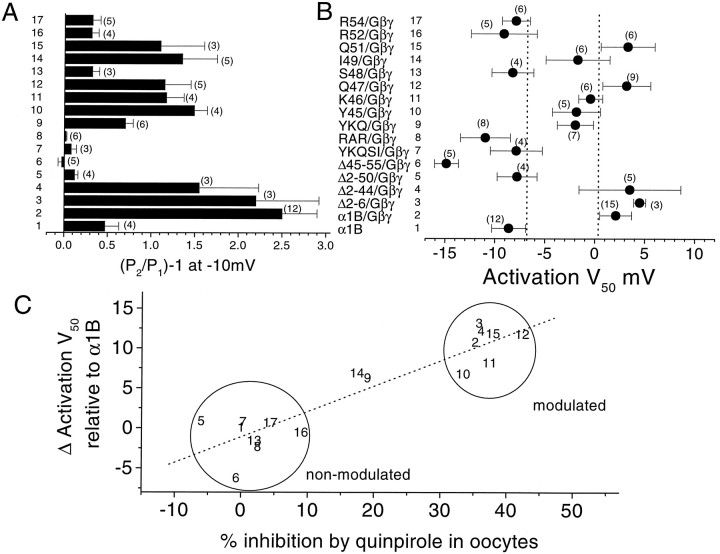
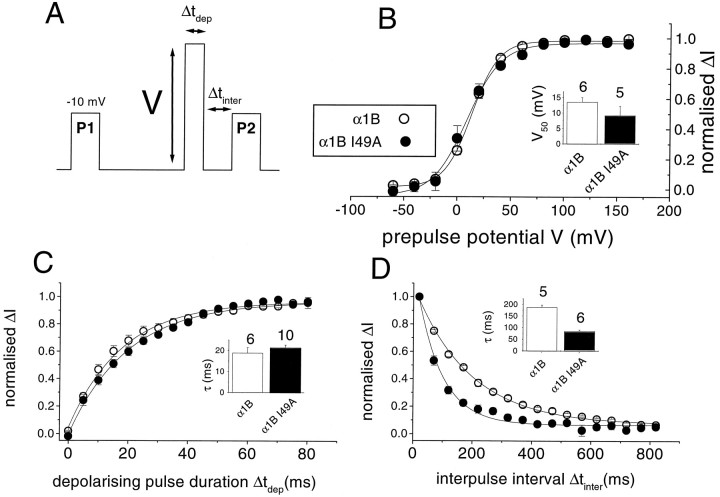
To examine the role of the intracellular N terminus in the G-protein modulation of the neuronal voltage-dependent calcium channel (VDCC) alpha1B, we have pursued two routes of investigation. First, we made chimeric channels between alpha1B and alpha1C, the latter not being modulated by Gbeta gamma subunits. VDCC alpha1 subunit constructs were coexpressed with accessory alpha2delta and beta2a subunits in Xenopus oocytes and mammalian (COS-7) cells. G-protein modulation of expressed alpha1 subunits was induced by activation of coexpressed dopamine (D2) receptors with quinpirole in oocytes, or by cotransfection of Gbeta1gamma2 subunits in COS-7 cells. For the chimeric channels, only those with the N terminus of alpha1B showed any G-protein modulation; further addition of the first transmembrane domain and I-II intracellular linker of alpha1B increased the degree of modulation. To determine the amino acids within the alpha1B N terminus, essential for G-protein modulation, we made mutations of this sequence and identified three amino acids (S48, R52, and R54) within an 11 amino acid sequence as being critical for G-protein modulation, with I49 being involved to a lesser extent. This sequence may comprise an essential part of a complex Gbeta gamma-binding site or be involved in its subsequent action.


Figures

Fig. 1.
Fig. 1.
G-protein modulation of chimeras between α1B and α1C. A, Chimeras made between α1B (white) and α1C (black), together with the nomenclature used. B, Chimeras and parental constructs were expressed in Xenopus oocytes together with α2δ and the dopamine D2 receptor. TheV50 in the absence and presence of the D2 agonist quinpirole (100 nm) was determined from current–voltage relationships performed before and during its application, as described in the legend to Table 1, and the ΔV50 was calculated (mean ± SEM). The number of experiments is given for each histogram bar. The statistical significance of ΔV50 was determined by paired t test; **p < 0.01.
Fig. 2.
Fig. 2.
Voltage dependence of modulation of the chimeras between α1B and α1C by activation of the dopamine D2 receptor. The percentage inhibition by quinpirole (100 nm) was determined at voltages between −20 and +30 mV, from current–voltage relationships performed in the absence and presence of quinpirole. Measurements were made isochronally, 20 msec after the start of the voltage step. A, α1B; B, α1bBbCCC;C, α1bBcCCC; D, α1bCbCCC; andE, α1bCcCCC. Experiments were performed both in the presence (white bars) and the absence (black bars) of overexpressed β2a, except for α1bCcCCC, where no expression was seen in the absence of β2a. The numbers of experiments (with, without β2a) are 8, 6 (A); 12, 6 (B); 7, 6 (C); 10, 6 (D); and 9 (E). The statistical significance of the differences at each potential between inhibition in the presence and absence of β2a is indicated by *p < 0.05; **p < 0.01. Example currents in the presence of β2a are given as insets to parts ACfor α1B and for all the chimeras shown. They were expressed as described in the legend to Figure 1. These traces were evoked by a pulse from −100 to 0 mV, and therefore do not show the maximum inhibition. Traces are shown before (con) and during quinpirole (100 nm) application (quin).F, Example traces showing the lack of effect of quinpirole on α1C, α1cBbCCC, α1cBcCCC, and α1cCbCCC, all expressed with β2a. The calibration bars are all 50 msec and 500 nA, unless otherwise stated.
Fig. 3.
Fig. 3.
Examples of direct modulation by Gβ1γ2 of the chimeras between α1B and α1C. The α1 subunits shown were coexpressed with α2δ, β2a, Gβ1, and Gγ2 in COS-7 cells.Left panel, Traces obtained before and after a depolarizing prepulse (+120 mV, 100 msec). The prepulse protocol is above the top trace. Right panel, Current–voltage relationships (steps from −40 to +50 mV in 10 mV intervals, from a holding potential of −100 mV), measured 50 msec after the start of the step, for the currents in P1 (open circle) and P2 (filled circle). The current–voltage relationships were fitted (solid lines) with a modified Boltzmann equation as given in the legend to Table 1. The mean depolarizing shifts in V50 resulting from the depolarizing prepulse are given in Figure 4. A,Currents resulting from α1B expression (currents shown resulting from steps −40 to 0 mV, and recorded in 1 mmBa2+). B, Currents resulting from α1bCbCCC expression (steps −40 to +20 mV shown, recorded in 10 mm Ba2+). C, Currents resulting from α1bCcCCC expression (steps −40 to +20 mV shown, recorded in 10 mm Ba2+).D, Currents resulting from α1C expression (steps −40 to −10 mV shown, recorded in 1 mmBa2+). In this example the depolarizing prepulse was not preceded by a 10 msec step to the holding potential, but this had no effect on the subsequent results.
Fig. 4.
Fig. 4.
Modulation by Gβ1γ2 of the chimeras between α1B and α1C. Histogram giving the mean ± SEM of the hyperpolarizing shifts in V50 after a depolarizing prepulse for the same chimeras as in Figure 1. *p < 0.05; **p < 0.001 compared to α1C/Gβ1γ2. All α1B currents were recorded with 1 mm Ba2+ and all chimeras with 10 mm Ba2+ as charge carrier. It was checked for parental α1B that the use of 1 or 10 mmBa2+ did not affect the ΔV50 caused by a depolarizing prepulse. For the bars marked control, the parental constructs were expressed without Gβγ subunits, in the presence of GDPβS (1 mm), and a small prepulse-induced hyperpolarizing shift inV50 was observed for α1B and α1C. A similar control shift was also observed for all the chimeras tested [for example for α1bCbCCC the control ΔV50 was −2.7 ± 0.8 mV (n = 8)]. This shift was not significantly different from that for α1C coexpressed with Gβ1γ2. The number of experiments performed is given at the base of each bar.
Fig. 5.
Fig. 5.
The effect of various deletions and point mutations of the N terminus of α1B on inhibition ofIBa by the D2 agonist quinpirole. The sequence of the N terminus of α1B, with the 11 amino acid sequence identified as being involved in G-protein modulation inbold, and the points at which deletions were made shown by arrows beneath the sequence. Example traces, showing the effect of quinpirole (100 nm) onIBa in the α1B Δ2–44 mutant (left), the α1B Δ45–55 mutant (center left), the α1B I49A mutant (center right), and the α1B R54A mutant (right). Traces (100 msec duration) were obtained at a test potential of 0 mV, from a holding potential of −100 mV. Con, Control traces;quin, after perfusion of quinpirole. Histogram of the percentage inhibition by 100 nm quinpirole (mean ± SEM) of IBa in the various deletion and point mutants of the N terminus of α1B. The currents were activated at 0 mV, and the degree of inhibition was determined from the currents activated every 15 sec. The number of experiments for each condition is given in parentheses, and the significance of the differences compared to the inhibition of α1B are given by *p < 0.005.
Fig. 6.
Fig. 6.
Examples of the effect of α1B N-terminal mutations on Gβγ modulation in COS-7 cells. Coexpression of two α1B N-terminal mutations with α2δ, β2a, and Gβ1γ2, recorded with 1 mm Ba2+ charge carrier.Left panel, Current traces are shown, evoked by the same protocol given in Figure 3. Right panel,Current–voltage relationships are given, from −40 to +50 mV, in 10 mV intervals, before (open circles) and after (filled circles) the depolarizing prepulse, fitted (solid lines) with the modified Boltzmann equation given in the legend to Table 1. A, The α1B Q47A mutation (traces from −40 to 0 mV are shown). B,The α1B R52A mutation (traces from −40 to +10 mV are shown).
Fig. 7.
Fig. 7.
Mean effect of α1B deletions and mutations on Gβγ modulation in COS-7 cells. A, The P2/P1 ratio was determined in COS-7 cells overexpressing Gβ1γ2, from current amplitudes during steps to −10 mV before and after a depolarizing prepulse (+120 mV, 100 msec), for the same N-terminal deletions and point mutations shown in Figure 5. Comparison is made with α1B in the absence of Gβγ, recorded with 1 mm GDPβS in the patch pipette (1). The value [(P2/P1) − 1] is plotted, which will be 0 if there is no facilitation. B, The activation V50 was determined for the same constructs coexpressed with Gβ1γ2, and compared to the value for α1B in the absence of Gβγ, recorded with 1 mm GDPβS in the patch pipette (1). The dashed lines are 1 SEM more positive than the mean value for α1B (1), and 1 SEM more negative than the mean value for α1B/Gβγ (2). C,Correlation between Δ activation V50 (the data given in B, after subtraction of theV50 for α1B) on the y-axis, and the data from Figure 5C (percentage inhibition ofIBa by 100 nm quinpirole), on the x-axis. The numbers identifying the constructs refer to the bars in A and B. Regression analysis (dotted line) gives a coefficient,r of 0.92 (p < 0.001). The data divide into a group of modulated and a group of nonmodulated constructs, as identified, except for constructs 14 (I49A) and 9 (YKQ→AAA).
Fig. 8.
Fig. 8.
Voltage dependence of inhibition, rate of loss of inhibition, and reinhibition rate for α1B and α1B I49A inXenopus oocytes. A, Voltage protocol, showing variation of the prepulse voltage (V), the prepulse duration (Δtdep), and the interpulse interval (Δtinter) between the prepulse and the test pulse. The prepulse potential was 100 mV and 50 msec duration, and the interpulse interval was 20 msec, unless these parameters were varied.B, Effect of increasing the 50 msec prepulse voltage (V) on prepulse facilitation in the presence of quinpirole. Facilitation was measured as (IBa in P2) − (IBa in P1) and normalized to the maximum facilitation observed (normalized ΔI). α1B (open circles), α1B I49A (filled circles). The inset histogram gives theV50 values (mean ± SEM, determined by fitting Boltzmann functions to the data from the number of individual experiments given above each bar) for α1B (white bar) and α1B I49A (black bar). C, Effect of increasing the duration of the 100 mV prepulse (Δtdep) on prepulse facilitation in the presence of quinpirole. Facilitation was measured as described inB. α1B (open circles), α1B I49A (filled circles). The insethistogram gives the τdissociation values (mean ± SEM, determined by fitting a single exponential to the data from the number of experiments given above each bar) for α1B (white bar) and α1B I49A (black bar).D, Effect of increasing the interval between the 100 mV, 50 msec prepulse and the subsequent test pulse P2 on the facilitation in the presence of quinpirole. Facilitation was measured as described in B: α1B (open circles), α1B I49A (filled circles). The insethistogram gives the τreinhibition values (mean ± SEM, determined by fitting a single exponential to the data from the number of experiments given above each bar) for α1B (white bar) and α1B I49A (black bar).

Similar articles

Cited by

References

    1. Bean BP. Neurotransmitter inhibition of neuronal calcium currents by changes in channel voltage-dependence. Nature. 1989;340:153–155. - PubMed
    1. Bourinet E, Soong TW, Stea A, Snutch TP. Determinants of the G protein-dependent opioid modulation of neuronal calcium channels. Proc Natl Acad Sci USA. 1996;93:1486–1491. - PMC - PubMed
    1. Brice NL, Berrow NS, Campbell V, Page KM, Brickley K, Tedder I, Dolphin AC. Importance of the different β subunits in the membrane expression of the α1A and α2 calcium channel subunits: studies using a depolarisation-sensitive α1A antibody. Eur J Neurosci. 1997;9:749–759. - PubMed
    1. Campbell V, Berrow N, Brickley K, Page K, Wade R, Dolphin AC. Voltage-dependent calcium channel β-subunits in combination with alpha1 subunits have a GTPase activating effect to promote hydrolysis of GTP by Gαo in rat frontal cortex. FEBS Lett. 1995a;370:135–140. - PubMed
    1. Campbell V, Berrow NS, Fitzgerald EM, Brickley K, Dolphin AC. Inhibition of the interaction of G protein Go with calcium channels by the calcium channel β-subunit in rat neurones. J Physiol (Lond) 1995b;485:365–372. - PMC - PubMed

Publication types

LinkOut - more resources