. 1999 Aug 15;19(16):6979-93.
doi: 10.1523/JNEUROSCI.19-16-06979.1999.

Thyroid hormone regulates reelin and dab1 expression during brain development

Affiliations

Thyroid hormone regulates reelin and dab1 expression during brain development

M Alvarez-Dolado et al. J Neurosci. .

Abstract

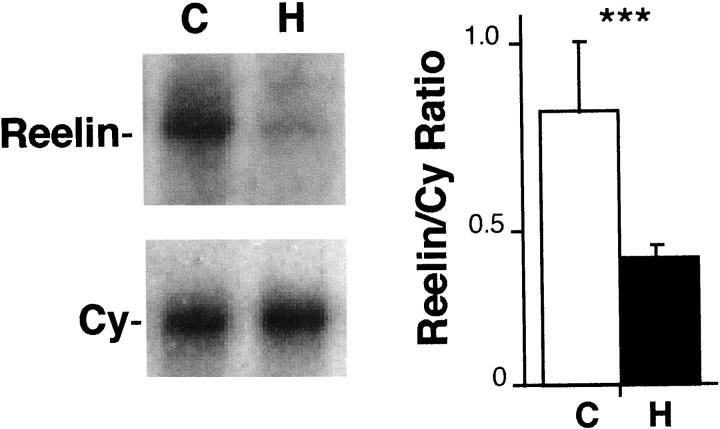
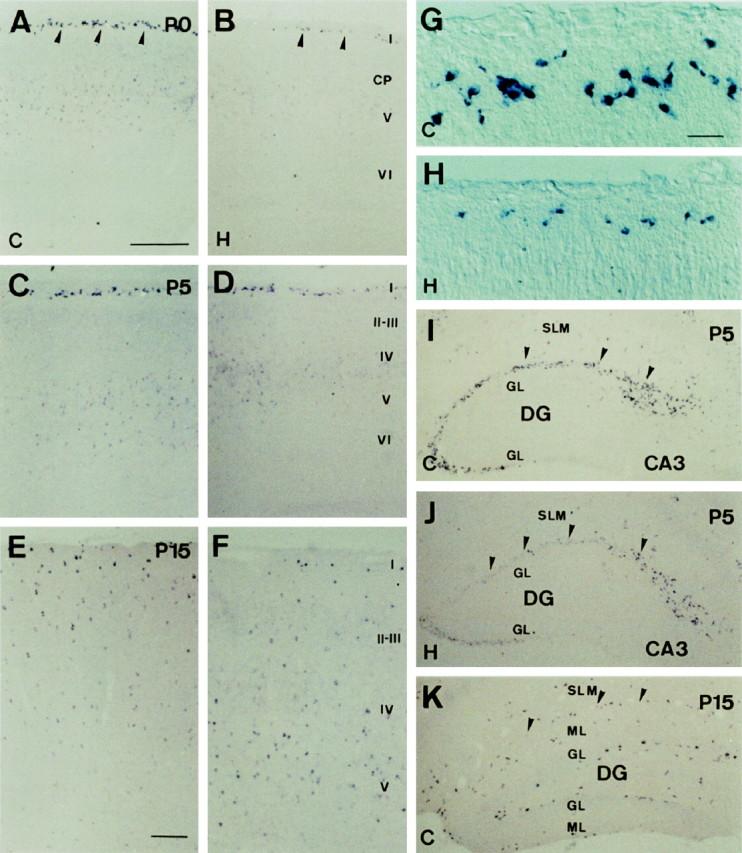
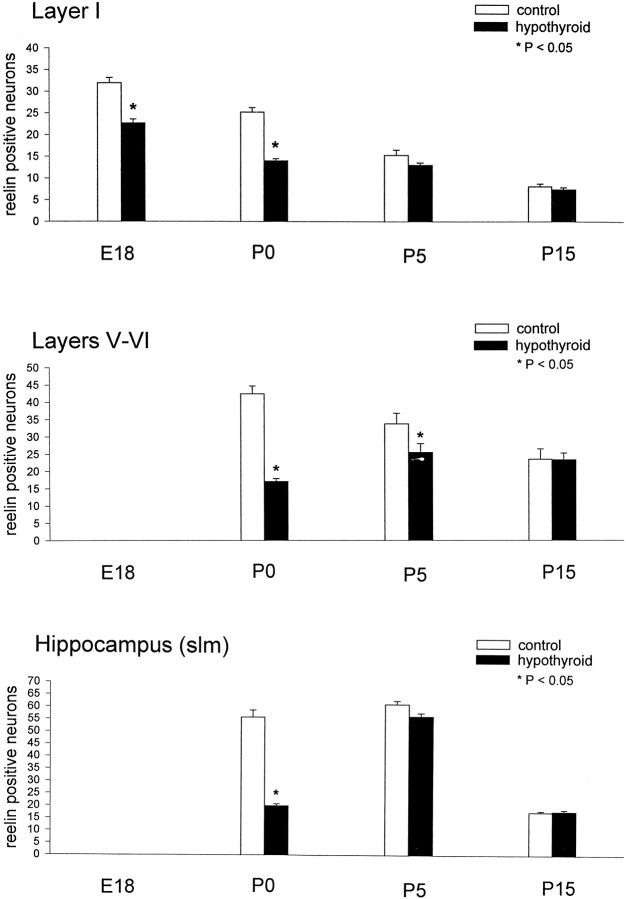
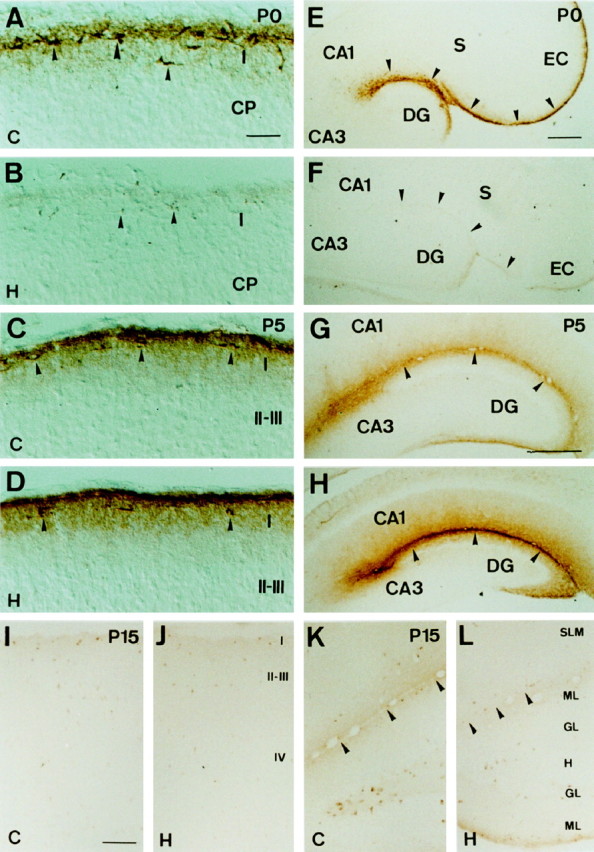
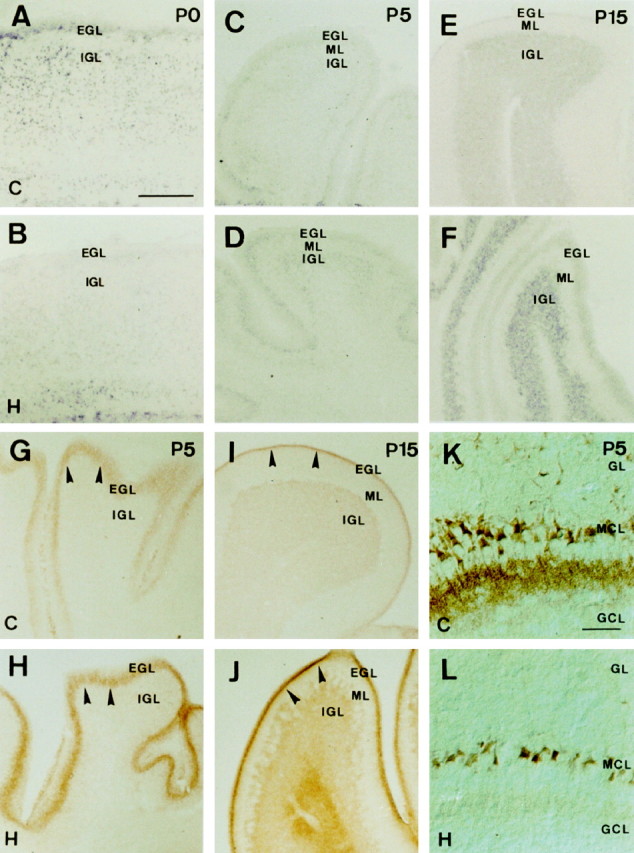
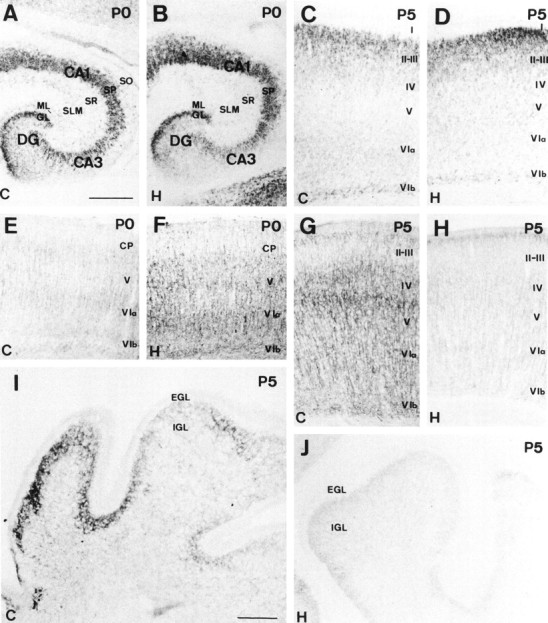
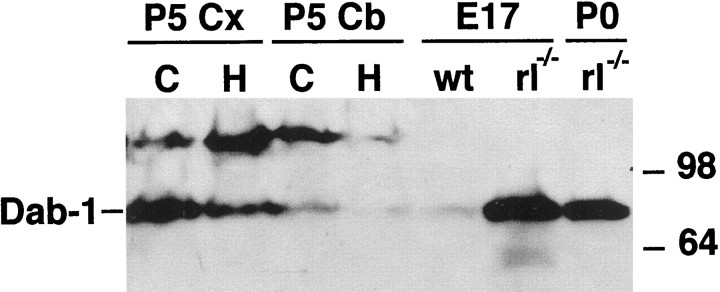
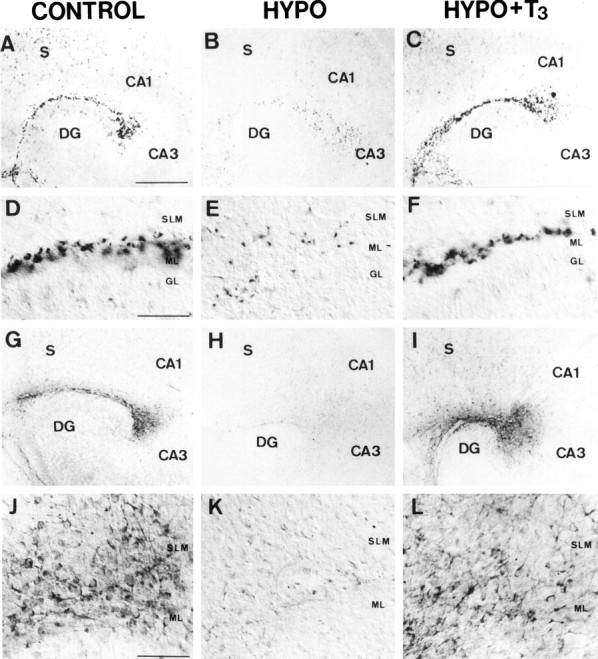
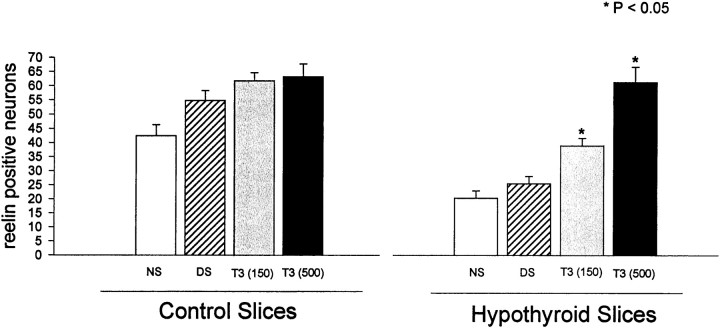
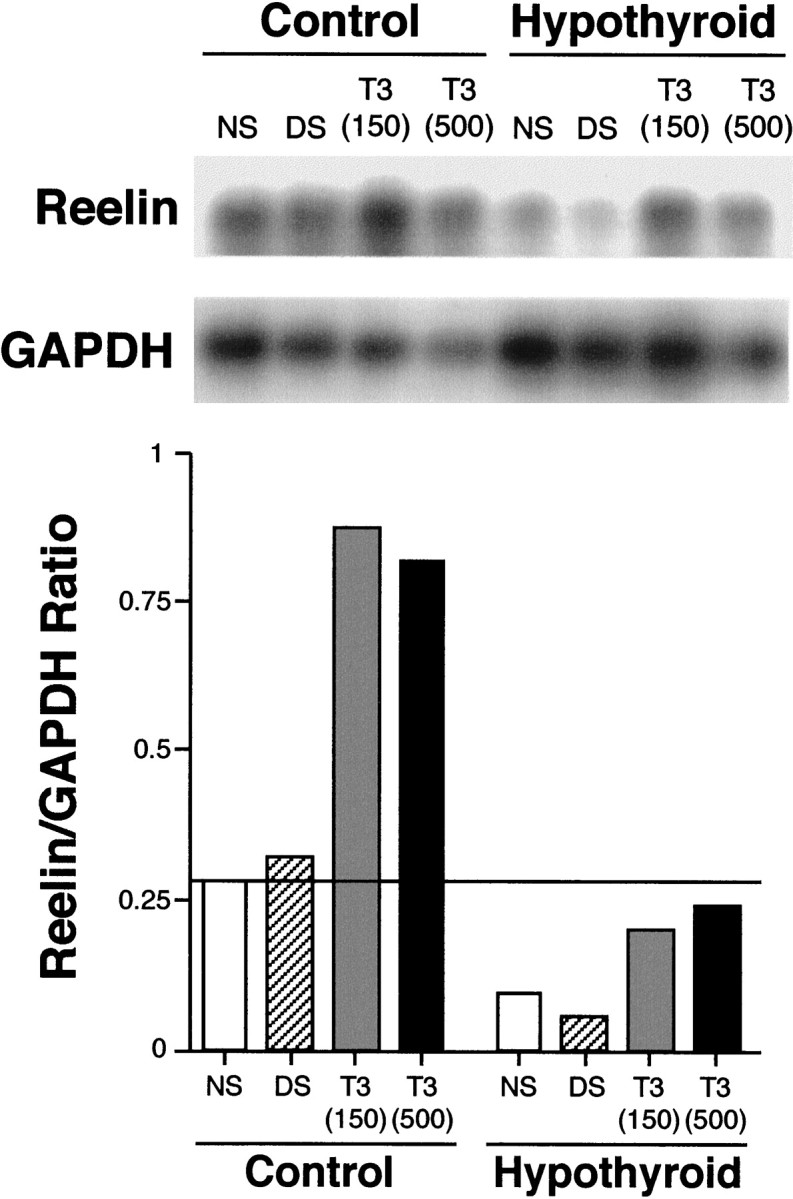
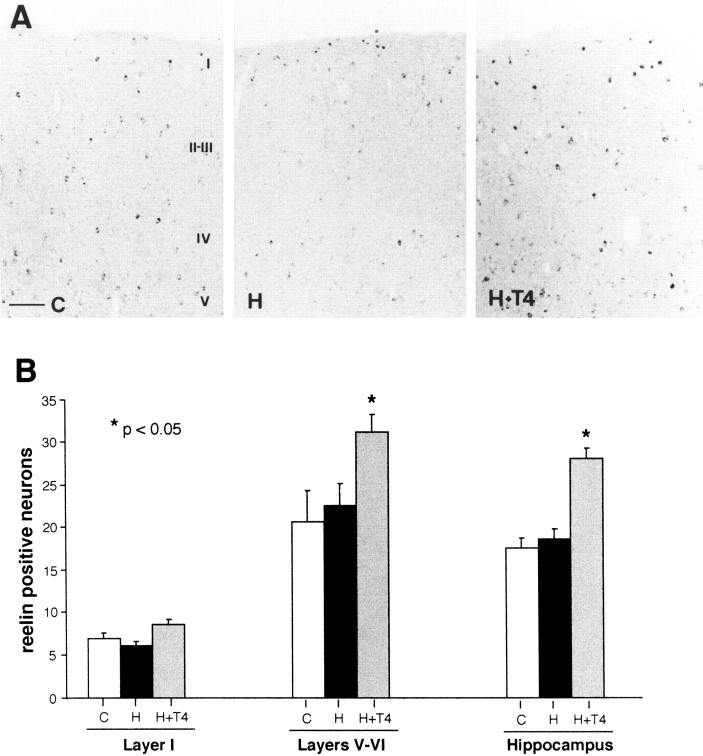
The reelin and dab1 genes are necessary for appropriate neuronal migration and lamination during brain development. Since these processes are controlled by thyroid hormone, we studied the effect of thyroid hormone deprivation and administration on the expression of reelin and dab1. As shown by Northern analysis, in situ hybridization, and immunohistochemistry studies, hypothyroid rats expressed decreased levels of reelin RNA and protein during the perinatal period [embryonic day 18 (E18) and postnatal day 0 (P0)]. The effect was evident in Cajal-Retzius cells of cortex layer I, as well as in layers V/VI, hippocampus, and granular neurons of the cerebellum. At later ages, however, Reelin was more abundant in the cortex, hippocampus, cerebellum, and olfactory bulb of hypothyroid rats (P5), and no differences were detected at P15. Conversely, Dab1 levels were higher at P0, and lower at P5 in hypothyroid animals. In line with these results, reelin RNA and protein levels were higher in cultured hippocampal slices from P0 control rats compared to those from hypothyroid animals. Significantly, thyroid-dependent regulation of reelin and dab1 was confirmed in vivo and in vitro by hormone treatment of hypothyroid rats and organotypic cultures, respectively. In both cases, thyroid hormone led to an increase in reelin expression. Our data suggest that the effects of thyroid hormone on neuronal migration may be in part mediated through the control of reelin and dab1 expression during brain ontogenesis.


Figures

Fig. 1.
Fig. 1.
Northern analysis of reelin RNA expression in newborn hypothyroid rats. Ten micrograms of poly(A)+ RNA from cerebral cortex of control (C) and hypothyroid (H) newborn (P0) rats (each sample corresponded to three pooled animals) were analyzed in Northern blots using a reelin cDNA probe as described in Materials and Methods. Cyclophilin (Cy) was used as a control gene. The levels of reelin RNA were quantitated using an Instant Imager apparatus (Packard). Data from three independent experiments are shown as mean ± SEM; ***p < 0.001.
Fig. 2.
Fig. 2.
Effects of hypothyroidism on reelinRNA expression in the cerebral cortex. A-F, Pattern ofreelin RNA expression in the neocortex of control (A, C, E) and hypothyroid (B, D, F) rats at P0 (A, B), P5 (C, D), and P15 (E, F). Cortical layers are indicated to the right. Note the decreased RNA levels in hypothyroid rats at P0 and P5. Arrowheads inA and B point to CR cells. G, H, High magnification photomicrographs illustratingreelin RNA-positive CR cells in layer I of the neocortex in control (G) and hypothyroid rats (H). I, J, Distribution ofreelin RNA-positive cells in the hippocampus of control (I) and hypothyroid (J) rats at P5, showing decreased RNA levels both in the stratum lacunosum-moleculare and in the remaining hippocampal layers. K, Distribution of reelinRNA-positive cells in the hippocampus of a control rat at P15. No differences were detected in hypothyroid rats at this age in this region. C, Control; H, hypothyroid;I—VI, cortical layers; CP, cortical plate; DG, dentate gyrus; GL, granule cell layer; ML, molecular layer; CA3,CA1, hippocampal subdivisions CA3 and CA1;SLM, stratum lacunosum-moleculare. Scale bars:A, 200 μm (applies to B–D, I, J);E, 100 μm (applies to F, K); G, 40 μm (applies to H).
Fig. 3.
Fig. 3.
Number of reelin RNA-positive neurons in control and hypothyroid rats in layer I and layers V/VI of the neocortex and in the stratum lacunosum-moleculare of the hippocampus. Data were quantitated as described in Materials and Methods (mean ± SEM; *p < 0.05). For cortical layer I and stratum lacunosum-moleculare, we analyzed four strips of three different animals, and for layers V/VI, we measured five sections of three different animals.
Fig. 4.
Fig. 4.
Reelin expression in the cerebral cortex of control and hypothyroid rats. A–D, Photomicrographs showing the distribution of CR50 immunostaining in layer I of control (A, C) and hypothyroid rats (B, D) at P0 (A, B) and P5 (C, D). Some CR50-positive CR cells are indicated by arrowheads. Note the decreased staining at P0 in hypothyroid animals. E–H, Pattern of CR50 immunostaining in the hippocampus of control (E, G) and hypothyroid rats (F, H) at P0 (E, F) and P5 (G, H), illustrating a clear reduction in the staining in hypothyroid rats at P0. The hippocampal fissure is indicated by arrowheads.I–L, Pattern of CR50 staining in the neocortex (I, J) and hippocampus (K, L) of control (I, K) and hypothyroid (J, L) rats at P15. No marked differences were found in both cortical regions at this age. C, Control; H, hypothyroid; EC, entorhinal cortex; other abbreviations are as in legend to Figure 2. Scale bars: A, 40 μm (applies toB–D); E, 200 μm (applies toF); G, 200 μm (applies toH); I, 100 μm (applies toJ–L).
Fig. 5.
Fig. 5.
Patterns of reelin RNA and protein distributions in the cerebellum and olfactory bulb of hypothyroid rats.A-F, Distribution of reelin RNA in the cerebellum of control (A, C, E) and hypothyroid (B, D, F) rats. Note the decreased RNA levels in hypothyroid rats at P0, and the opposite increased levels at P5 and P15 in these animals. G–J, Pattern of CR50 immunostaining in the cerebellum of control (G, I) and hypothyroid (H, J) rats at P5 (G, H) and P15 (I, J). Increased Reelin levels are observed in hypothyroid rats.Arrowheads point to the external granule cell layer.K, L, CR50 immunostaining in the olfactory bulb of control (K) and hypothyroid (L) rats at P5, illustrating the decreased immunolabeling in the mitral cells and glomerular neurons in hypothyroid rats. EGL, External granule cell layer;IGL, internal granule cell layer; ML, molecular layer; WM, white matter; MCL, mitral cell layer; GCL, granule cell layer;GL, glomerular cell layer. Scale bars: A, 200 μm (applies to B–J); K, 40 μm (applies to L).
Fig. 6.
Fig. 6.
Distribution of dab1 RNA and protein levels in the cerebral cortex and cerebellum of control (C) and hypothyroid (H) rats. A–D, Pattern ofdab1 RNA hybridization at P0 and P5 in control (A, C) and hypothyroid (B, D) rats in the hippocampus (A, B) and neocortex (C, D).dab1 is widely expressed within the cerebral cortex, and no major differences are observed between control and hypothyroid rats.E–H, Distribution of Dab1 immunolabeling in the neocortex of control (E, G) and hypothyroid (F, H) rats at P0 and P5. Increased levels of Dab1 immunoreactivity are observed in hypothyroid rats at P0, whereas the opposite occurs at P5. I, J, Photomicrographs illustrating decreased Dab1 immunostaining in the cerebellum of hypothyroid (J) compared to controls (I) rats at P5. Abbreviations are as in legends to Figures 2 and 5. Scale bars: A, 200 μm (applies to B–H); I, 100 μm (applies to J).
Fig. 7.
Fig. 7.
Western blot analysis of the expression of Dab1 in the cortex (Cx) and cerebellum (Cb) of control (C) and hypothyroid (H) rats at P5. Total brain extracts from wild-type (wt) and reeler (rl−/−) mice at the indicated ages were used as controls, showing a high increase in Dab1 content in reeler mutants. Numbers to the right indicate Mr of marker proteins.
Fig. 8.
Fig. 8.
reelin RNA (A–F) and protein (G–L) expression in hippocampal organotypic slice cultures. Left panels,(A–J), Slices from euthyroid rats incubated for 6 d in standard serum. Middle panels,(B–K), Slices from hypothyroid rats incubated for 6 d in thyroid-depleted serum. Right panels,(C–L), Slices from hypothyroid rats incubated for 6 d in T3/T4-depleted serum supplemented with 500 nm T3. Note that the reduced expression levels in hypothyroid slices are rescued by T3 treatment. Higher magnification photomicrographs illustrating reelin RNA (D–F) and protein (J–L) in the CR cells of the hippocampus are shown. Abbreviations are as in legends to Figure 2; S, subiculum. Scale bars:A, 300 μm (applies to B, C, andG–I); D, 75 μm (applies toE, F); J, 50 μm (applies toK, L).
Fig. 9.
Fig. 9.
Density of reelin RNA-positive neurons in the stratum lacunosum-moleculare of hippocampal slice cultures from control and hypothyroid newborn (P0) rats. Organotypic slices were incubated in standard normal serum (NS) or in T3/T4-depleted serum (DS) supplemented or not with T3 as indicated. For statistical analysis, T3-treated slices were compared to untreated DS slices. Note the increase inreelin-positive cells caused by T3 treatment. Data were quantitated as described in Materials and Methods (mean ± SEM; *p < 0.05). Each value corresponds to five strips of two different slices.
Fig. 10.
Fig. 10.
RT-PCR analysis of reelin RNA expression in organotypic cultures. A, Total RNAs were prepared from the same four types of slices as in legend to Figure 9and then were retrotranscribed and analyzed as described in Materials and Methods to estimate the expression of reelin RNA. GAPDH gene was used as internal control. B, Quantitation of the reelin/GAPDH ratio of RNA expression.
Fig. 11.
Fig. 11.
Effect of thyroid hormone treatmentin vivo on the number of reelin-positive cells present in P15 rats. A, Photomicrographs illustrating the level of reelin RNA expression in the parietal cortex of control (C), hypothyroid (H), and hypothyroid rats treated with T4 (H+T4), as described in Materials and Methods. B, Number of reelinRNA-positive neurons in the neocortex (layers I and V/VI) and hippocampus (SLM) of the three groups of animals. Data were quantitated as described in Materials and Methods (mean ± SEM; *p < 0.05). For cortical layer I and SLM each value corresponds to three strips of four different animals, and for layers V/VI to four sections of three animals. Abbreviations are as in legend to Figure 2. Scale bar, 100 μm.

Similar articles

Cited by

References

    1. Alcántara S, Ruiz M, D’Arcangelo G, Ezan F, de Lecea L, Curran T, Sotelo C, Soriano E. Regional and cellular patterns of reelin mRNA expression in the forebrain of the developing and adult mouse. J Neurosci. 1998;18:7779–7799. - PMC - PubMed
    1. Alvarez-Dolado M, Iglesias T, Rodríguez-Peña A, Bernal J, Muñoz A. Expression of neurotrophins and the trk family of neurotrophin receptors in normal and hypothyroid rat brain. Mol Brain Res. 1994;27:249–257. - PubMed
    1. Alvarez-Dolado M, González-Sancho J, Bernal J, Muñoz A. Developmental expression of tenascin-C is altered by hypothyroidism in the rat brain. Neuroscience. 1998;84:309–322. - PubMed
    1. Aniello F, Couchie D, Bridoux AM, Gripois D, Nunez J. Splicing of juvenile and adult tau m-RNA variants is regulated by thyroid hormone. Proc Natl Acad Sci USA. 1991;88:4035–4039. - PMC - PubMed
    1. Berbel P, Guadaño-Ferraz A, Martínez M, Quiles J, Balboa R, Innocenti G. Organization of auditory callosal connections in hypothyroid rats. Eur J Neurosci. 1993;5:1465–1478. - PubMed

Publication types

MeSH terms