Clinical Trial
. 1999 Aug 15;19(16):7152-61.
doi: 10.1523/JNEUROSCI.19-16-07152.1999.

Human gamma band activity and perception of a gestalt

Affiliations
Clinical Trial

Human gamma band activity and perception of a gestalt

A Keil et al. J Neurosci. .

Abstract

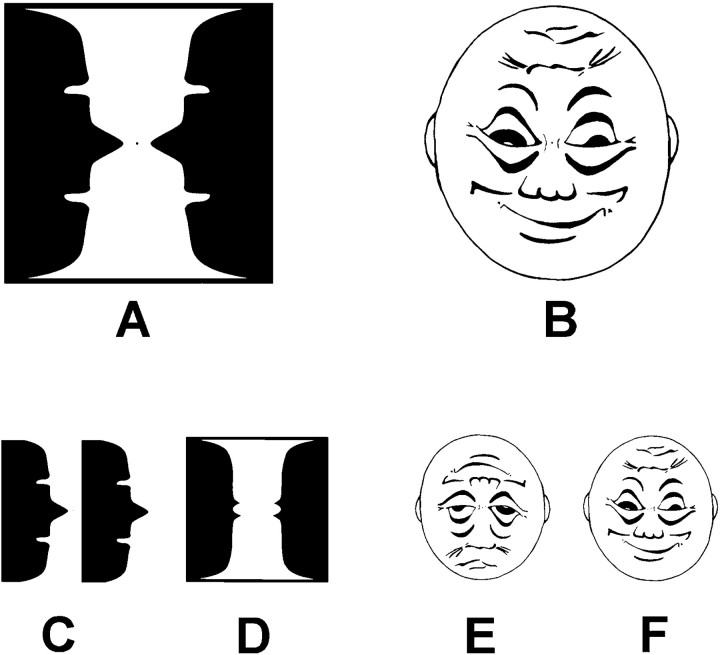
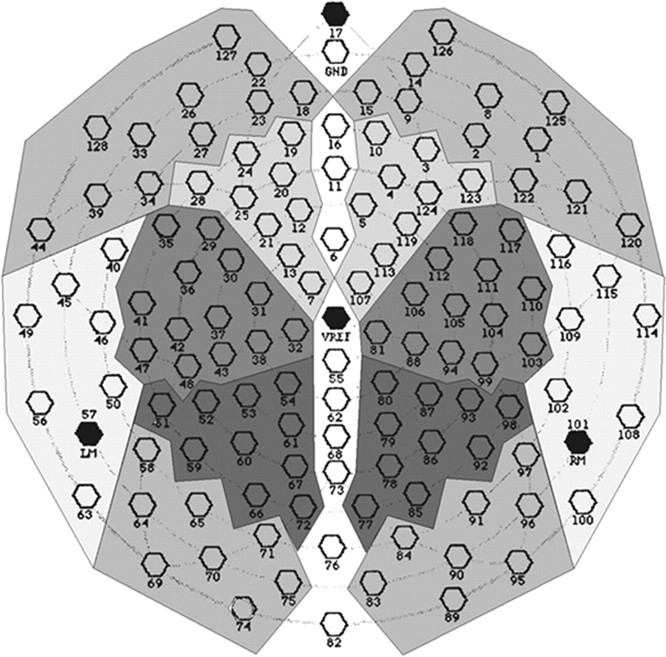
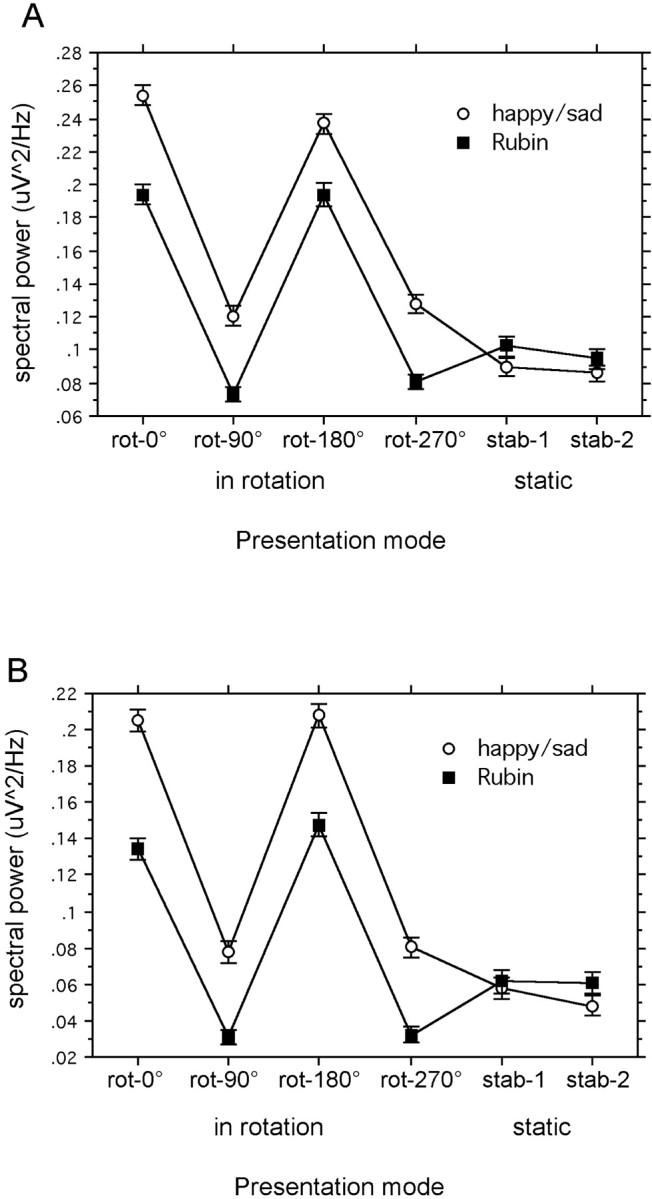
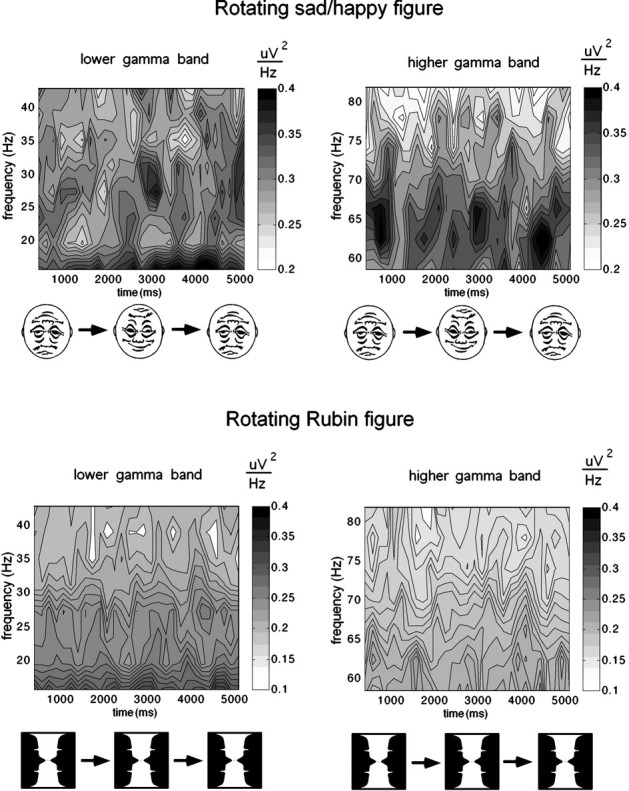
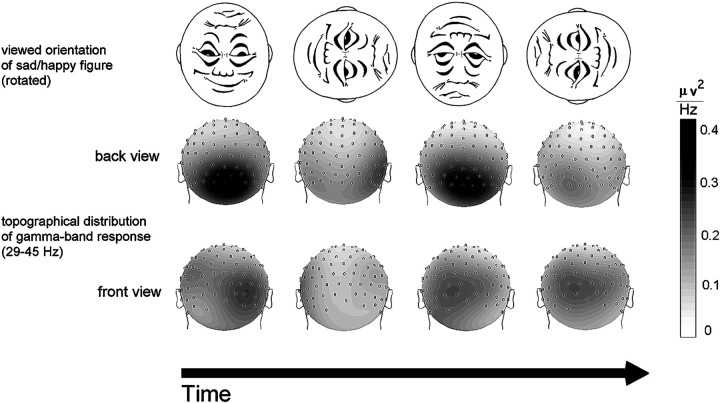
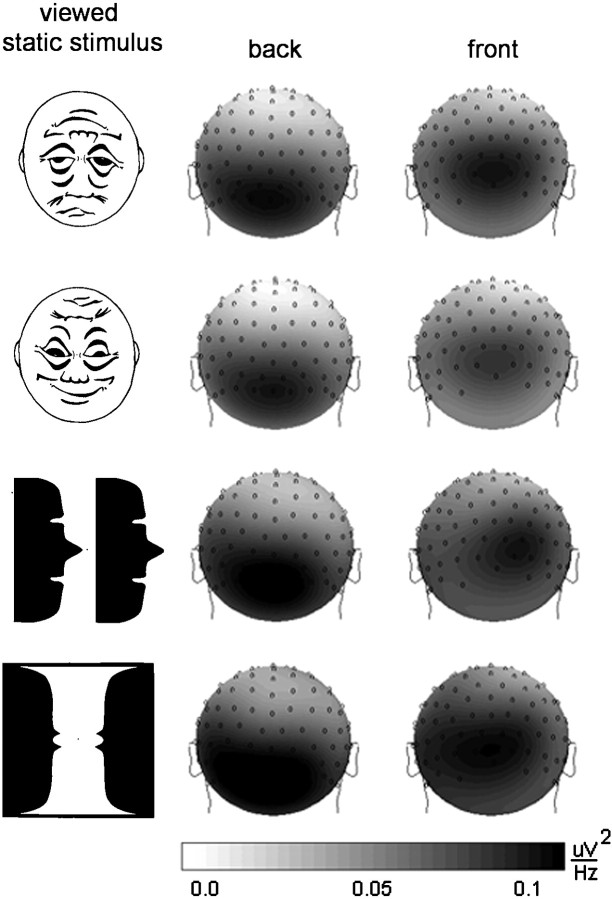
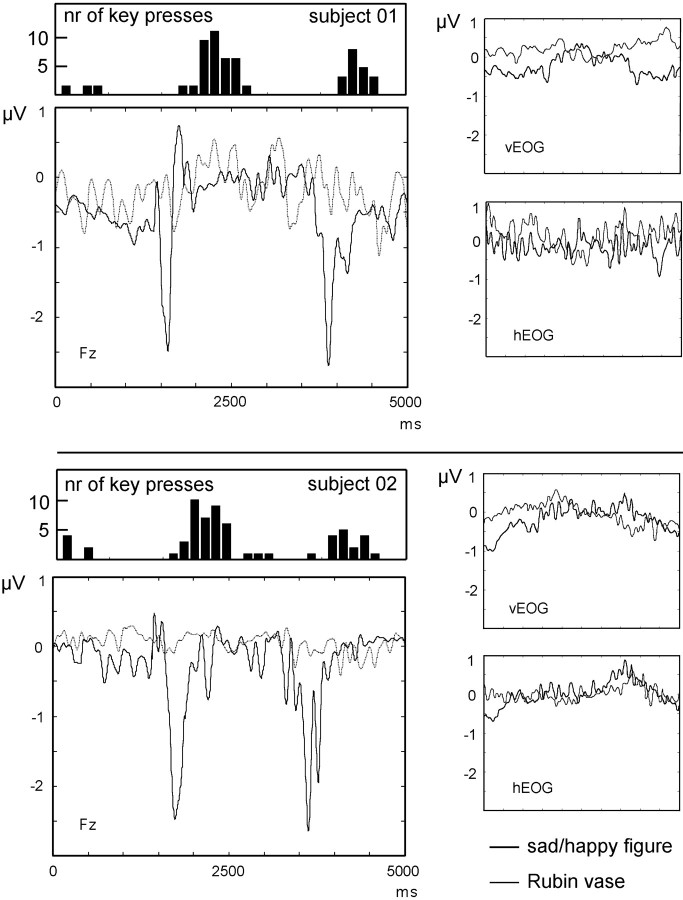
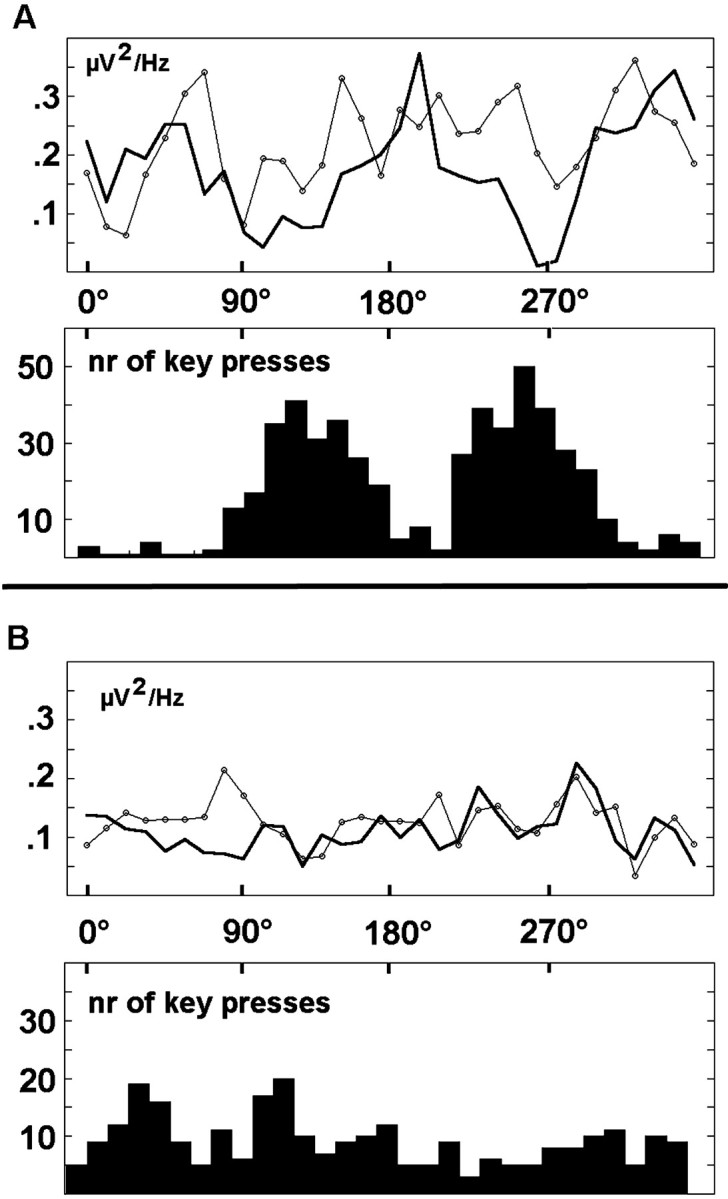
Neuronal oscillations in the gamma band (above 30 Hz) have been proposed to be a possible mechanism for the visual representation of objects. The present study examined the topography of gamma band spectral power and event-related potentials in human EEG associated with perceptual switching effected by rotating ambiguous (bistable) figures. Eleven healthy human subjects were presented two rotating bistable figures: first, a face figure that allowed perception of a sad or happy face depending on orientation and therefore caused a perceptual switch at defined points in time when rotated, and, second, a modified version of the Rubin vase, allowing perception as a vase or two faces whereby the switch was orientation-independent. Nonrotating figures served as further control stimuli. EEG was recorded using a high-density array with 128 electrodes. We found a negative event-related potential associated with the switching of the sad-happy figure, which was most pronounced at central prefrontal sites. Gamma band activity (GBA) was enhanced at occipital electrode sites in the rotating bistable figures compared with the standing stimuli, being maximal at vertical stimulus orientations that allowed an easy recognition of the sad and happy face or the vase-faces, respectively. At anterior electrodes, GBA showed a complementary pattern, being maximal when stimuli were oriented horizontally. The findings support the notion that formation of a visual percept may involve oscillations in a distributed neuronal assembly.


Figures

Fig. 1.
Fig. 1.
Experimental stimuli. A,B, Ambiguous figures presented in clockwise rotation: modified version of the Rubin vase (left). The sad–happy figure, which induces perceptual transitions according to degree of rotation (right). Both figures are shown at 0° of rotation. C–F, Low-ambiguous control figures that were presented in a static (nonrotating) mode.
Fig. 2.
Fig. 2.
Layout of the electrode array. Electrodes in theshaded clusters, corresponding with sites of the international 10–20 system, were grouped for statistical analysis. Frontal electrodes are shown at the top of the figure.
Fig. 3.
Fig. 3.
Interaction plots of the effects FIGURE × VIEW in both frequency bands. Spectral power for the two ambiguous figures in four orientations while rotating and two different stable presentation modes for each figure type. Values represent a mean of 11 subjects. A shows the frequency band 29–45 Hz;B shows the frequency band 55–71 Hz. Error bars indicate SE.
Fig. 4.
Fig. 4.
Time–frequency contour plots for the time course of spectral power measured at posterior recording sites (electrodes 69, 70, 71, 74, 75, 76, 82, 83, 84, 89, 90, and 95) averaged across all revolutions of the rotating figures. Values represent a mean of 11 subjects. Left panels show the frequency range from 15 to 45 Hz; right panels show the range from 55 to 71 Hz. Note that scaling is different for the Rubin stimulus (bottom) and the sad–happy figure (above).
Fig. 5.
Fig. 5.
Topography of the grand mean gamma band power (29–45 Hz) during four different orientations of the sad–happy figure. Values represent a mean of 11 subjects. The depicted time course reflects one complete revolution of the stimulus, i.e., 5 sec.
Fig. 6.
Fig. 6.
Topographical distribution of gamma band response (29–45 Hz) to four types of low-ambiguous figures presented in a static (nonrotating) manner. Values represent a mean of 11 subjects.
Fig. 7.
Fig. 7.
Event-related potential obtained at central frontal electrode 11 for two subjects during observation of rotating stimuli. The depicted time course reflects the averaged potential across all revolutions of the stimuli, starting with the sad orientation of the sad–happy figure (black lines) and the respective vertical orientation of the Rubin figure (gray lines). Thus, two transitions between percepts are observed in the sad–happy figure. The sad–happy condition shows pronounced negativity at horizontal orientations of the figure. No ERP peaks are visible in the Rubin vase condition. Histograms above ERP plots show the frequency of key presses, indicating figure switching for the different orientations of the sad–happy figure. The high degree of variability in the timing of subjective perceptual switching between alternatives is reflected in the ERP peak latency differences. Right panels show vertical and horizontal EOG.
Fig. 8.
Fig. 8.
Behavioral responses and time course of averaged GBP in the two examined bands. Bold line, GBP 29–45 Hz;line with circles, GBP 55–71 Hz. Histograms show the frequency of key presses, indicating figure switching with respect to orientations of the rotating sad–happy figure (A) and the rotating Rubin vase (B). Values represent a mean ofn = 11 subjects.

References

    1. Attneave F. Multistability in perception. Sci Am. 1971;225:63–71. - PubMed
    1. Bair W, Koch C, Newsome W, Britten K. Power spectrum analysis of bursting cells in area MT in the behaving monkey. J Neurosci. 1994;14:2870–2892. - PMC - PubMed
    1. Basar-Eroglu C, Struber D, Kruse P, Basar E, Stadler M. Frontal gamma-band enhancement during multistable visual perception. Int J Psychophysiol. 1996;24:113–125. - PubMed
    1. Bobes MA, Valdes-Sosa M, Olivares E. An ERP study of expectancy violation in face perception. Brain Cogn. 1994;26:1–22. - PubMed
    1. Cacioppo JT, Tassinary LG, Fridlund AJ. The skeletomotor system. In: Cacioppo JT, Tassinary JT, editors. Principles of psychophysiology: physical, social, and inferential elements. Cambridge UP; Cambridge, MA: 1990. pp. 325–384.

Publication types

LinkOut - more resources