Comparative Study
. 1999 Aug 9;146(3):609-20.
doi: 10.1083/jcb.146.3.609.

Two compartments for insulin-stimulated exocytosis in 3T3-L1 adipocytes defined by endogenous ACRP30 and GLUT4

Affiliations
Comparative Study

Two compartments for insulin-stimulated exocytosis in 3T3-L1 adipocytes defined by endogenous ACRP30 and GLUT4

J S Bogan et al. J Cell Biol. .

Abstract

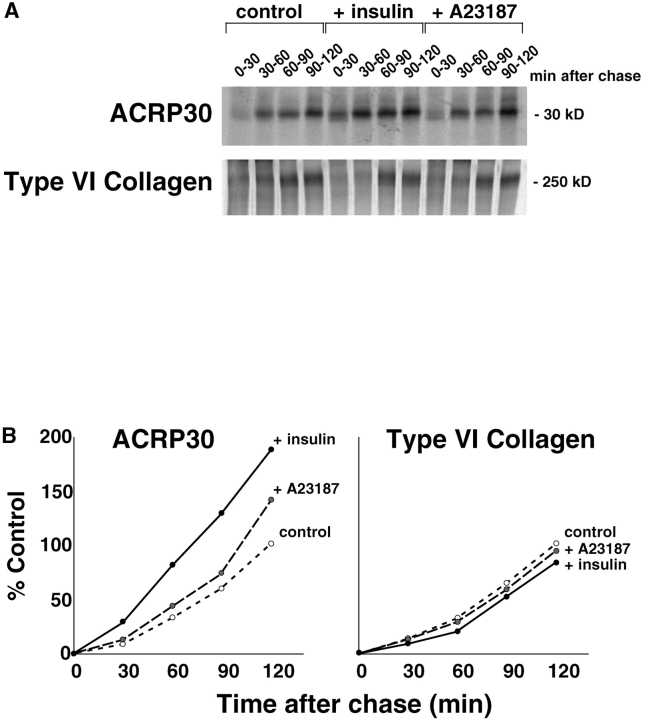
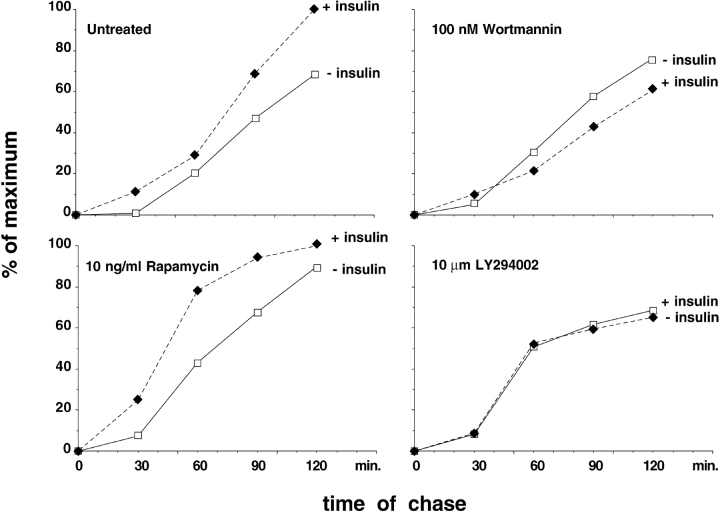
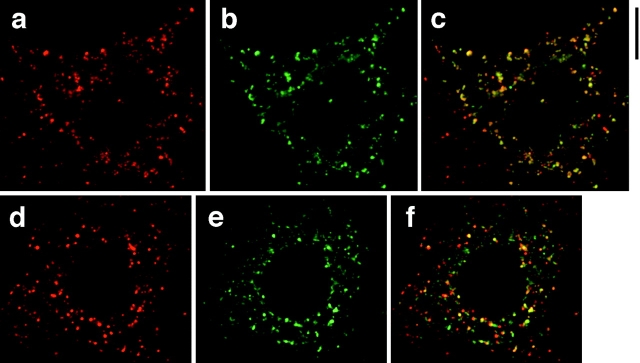
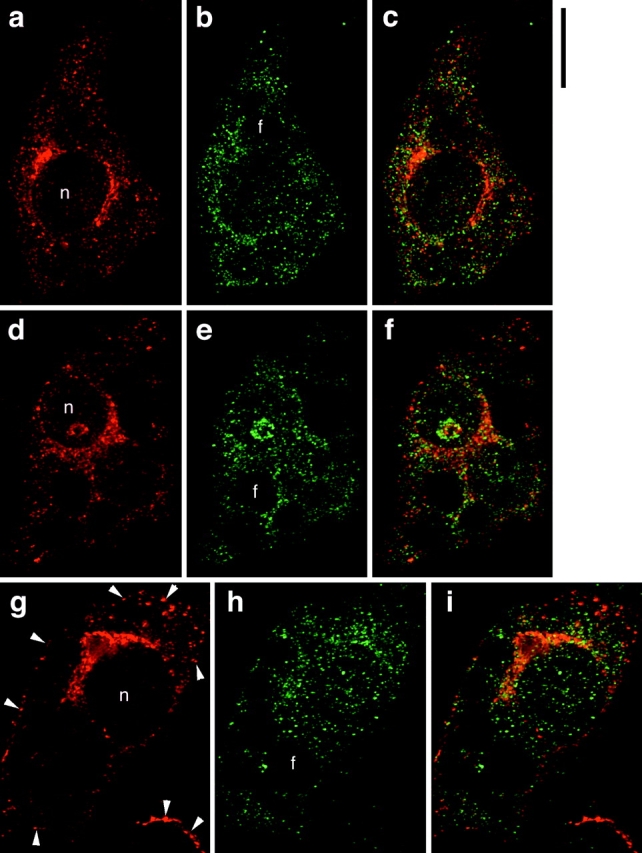
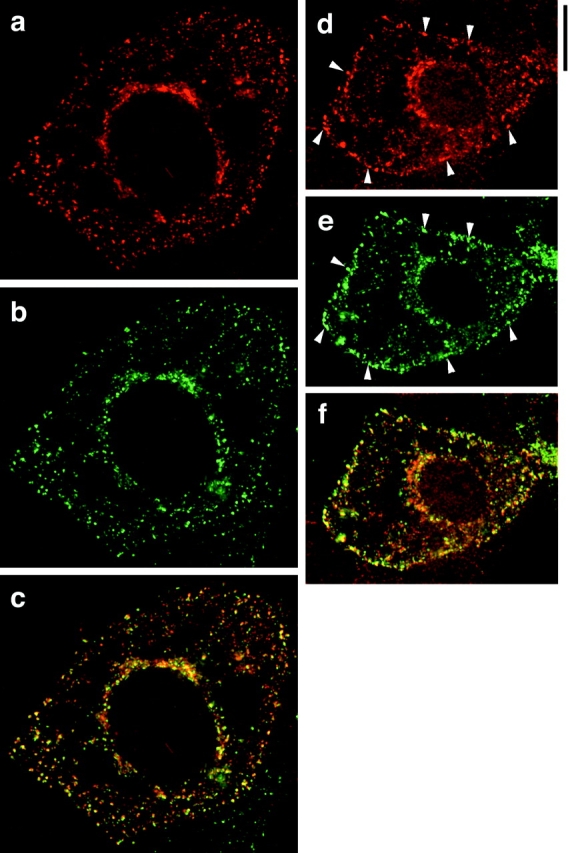
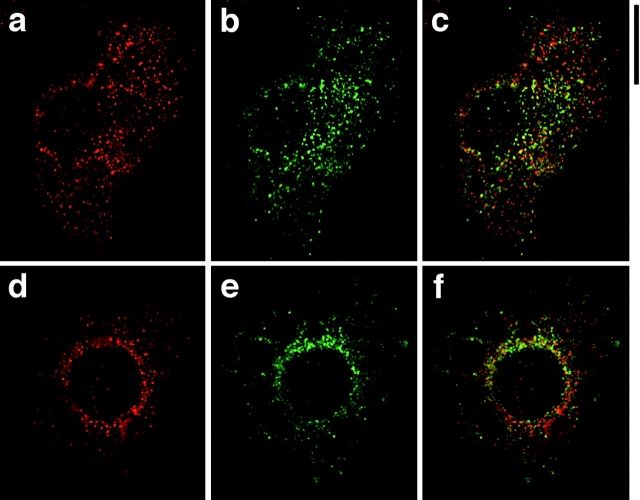
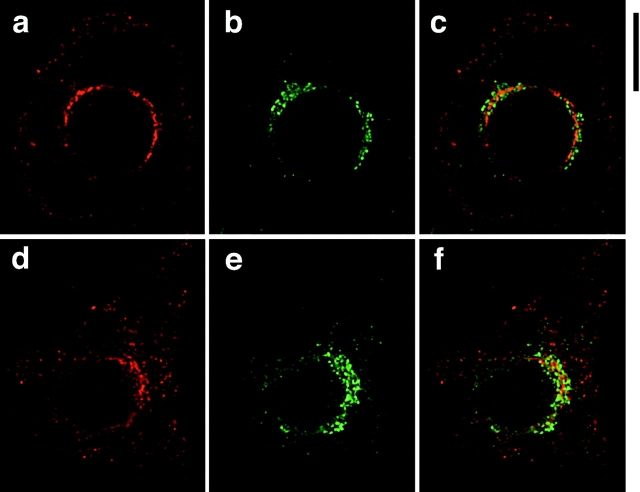
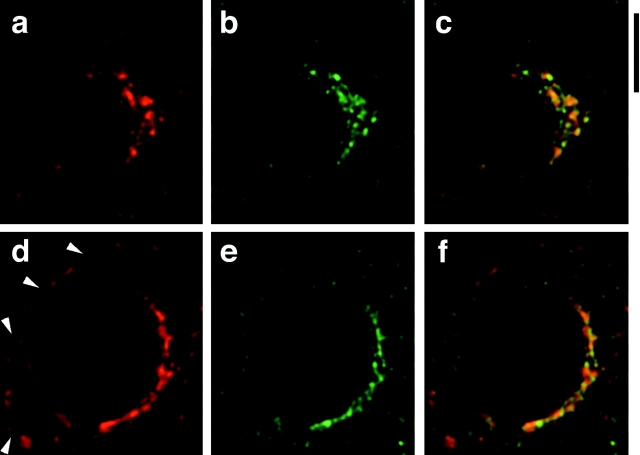
Insulin stimulates adipose cells both to secrete proteins and to translocate the GLUT4 glucose transporter from an intracellular compartment to the plasma membrane. We demonstrate that whereas insulin stimulation of 3T3-L1 adipocytes has no effect on secretion of the alpha3 chain of type VI collagen, secretion of the protein hormone adipocyte complement related protein of 30 kD (ACRP30) is markedly enhanced. Like GLUT4, regulated exocytosis of ACRP30 appears to require phosphatidylinositol-3-kinase activity, since insulin-stimulated ACRP30 secretion is blocked by pharmacologic inhibitors of this enzyme. Thus, 3T3-L1 adipocytes possess a regulated secretory compartment containing ACRP30. Whether GLUT4 recycles to such a compartment has been controversial. We present deconvolution immunofluorescence microscopy data demonstrating that the subcellular distributions of ACRP30 and GLUT4 are distinct and nonoverlapping; in contrast, those of GLUT4 and the transferrin receptor overlap. Together with supporting evidence that GLUT4 does not recycle to a secretory compartment via the trans-Golgi network, we conclude that there are at least two compartments that undergo insulin-stimulated exocytosis in 3T3-L1 adipocytes: one for ACRP30 secretion and one for GLUT4 translocation.


Figures

Figure 1
Figure 1
Insulin stimulates ACRP30 secretion from 3T3-L1 adipocytes, but does not stimulate α3 (VI) collagen secretion. Three 10-cm plates of 3T3-L1 adipocytes were serum-starved and total cellular protein was labeled with a 15-min pulse of 35S-labeled cysteine and methionine. Cells were washed and then chased in serum-free media containing cycloheximide to inhibit further protein synthesis. Additionally during the chase period, cells were maintained in the presence or absence of 160 nM insulin or 200 μM A23187. The media were collected and replaced at 30-min intervals, and the appearance of labeled ACRP30 or α3 (VI) collagen in the media was assessed by sequential immunoprecipitations. The immunoprecipitates were analyzed SDS-PAGE, and bands were detected and quantified using a PhosphorImager. A shows the bands corresponding to ACRP30 and α3 (VI) collagen for each condition. In B, these bands were quantified and the cumulative secretion into the media is plotted for each protein. The total amount of protein secreted by unstimulated cells is taken as 100% and all other data are plotted relative to this amount.
Figure 2
Figure 2
PI-3 kinase inhibitors block insulin-stimulated, but not basal, ACRP30 secretion. Eight 10-cm plates of 3T3-L1 adipocytes were serum-starved and then treated or not with wortmannin, LY294002, or rapamycin at the indicated concentrations for 45 min. As in Fig. 1, total cellular protein was labeled with a 15-min pulse of 35S-labeled cysteine and methionine, followed by inhibition of further protein synthesis with cycloheximide. During the chase period, cells were maintained in the presence or absence of 160 nM insulin and the continued presence or absence of inhibitors, and the medium was collected and replaced at 30-min intervals. ACRP30 was quantitatively immunoprecipitated from the media collected at each time point. The immunoprecipitates were separated by SDS-PAGE and the amount of ACRP30 present at each data point was quantified using a PhosphorImager. Cumulative ACRP30 is plotted for cells chased in the absence (open squares) or presence (filled diamonds) of insulin. The total amount of protein secreted by the untreated cells in the presence of insulin is taken as 100%; all other data are plotted relative to this amount.
Figure 3
Figure 3
ACRP30 and GRP94 staining partially overlap. 3T3-L1 adipocytes were costained for ACRP30 (shown in green) and GRP94 (shown in red), and optical cross-sections were acquired by deconvolution immunofluorescence microscopy. To demonstrate a large amount of staining for both proteins, the images presented are merged stacks of nine optical cross-sections spanning a total of 2.25 μm perpendicular to the image plane; a similar degree of overlap was observed in individual cross-sections. GRP94 staining is shown in a and d; ACRP30 staining is shown in b and e. Merged images are shown in c and f. a–c show staining of unstimulated 3T3-L1 adipocytes, and d–f show staining of insulin-stimulated 3T3-L1 adipocytes. Bar, 10 μm.
Figure 4
Figure 4
ACRP30 and GLUT4 do not colocalize in 3T3-L1 adipocytes. Immunofluorescence of GLUT4 (red) and ACRP30 (green) was performed on 3T3-L1 adipocytes, and optical cross-sections were acquired by deconvolution microscopy. The images presented are views through nine optical cross-sections. GLUT4 staining is shown in a, d, and g; ACRP30 staining is shown in b, e, and h. Merged images are shown in c, f, and i. a–f show staining of unstimulated cells, and g–i show staining of insulin-stimulated cells. Arrowheads highlight increased plasma membrane localization of GLUT4 in cells stimulated with insulin. n, nucleus. f, lipid. Bar, 10 μm.
Figure 5
Figure 5
GLUT4 and TfnR overlap. Immunofluorescence of GLUT4 (red) and TfnR (green) was performed on 3T3-L1 adipoctes. As in Fig. 4, each image is a merged composite of nine adjacent optical cross-sections; a similar degree of overlap was seen in individual cross-sectional images. GLUT4 staining is shown in a and d; TfnR staining is shown in b and e. Merged images are shown in c and f. a–c show staining of unstimulated cells, and d–f show staining of insulin-stimulated cells. Arrowheads highlight increased plasma membrane localization of both GLUT4 and TfnR after insulin stimulation. Bar, 10 μm.
Figure 6
Figure 6
ACRP30 and TfnR do not colocalize. Immunofluorescence of 3T3-L1 adipocytes stained for ACRP30 (red) and TfnR (green). Each image is the merged stack of nine optical cross-sections, as in Fig. 4 and Fig. 5. ACRP30 staining is shown in a and d; TfnR staining is shown in b and e. Merged images are shown in c and f. a–c show staining of unstimulated 3T3-L1 adipocytes, and d–f show staining of insulin-stimulated 3T3-L1 adipocytes. Bar, 10 μm.
Figure 7
Figure 7
Perinuclear GLUT4 and β-COP staining do not overlap. Immunofluorescence of 3T3-L1 adipocytes stained for GLUT4 (red) and β-COP (green) was performed and optical cross-sections were acquired by deconvolution microscopy. The images shown are the center cross-sections from the reconstructed stack of images. GLUT4 staining is shown in a and d; β-COP staining is shown in b and e. Merged images are shown in c and f. a–c show staining of unstimulated 3T3-L1 adipocytes, and d–f show staining of insulin-stimulated 3T3-L1 adipocytes. Bar, 10 μm.
Figure 8
Figure 8
Perinuclear GLUT4 and γ-adaptin staining are mostly separate. 3T3-L1 adipocytes were stained for GLUT4 (red) and γ-adaptin (green) before deconvolution microscopy. The images shown are the center cross-sections from the deconvolved set of images. GLUT4 staining is shown in a and d; γ-adaptin staining is shown in b and e. Merged images are shown in c and f. a–c show staining of unstimulated 3T3-L1 adipocytes, and d–f show staining of insulin-stimulated 3T3-L1 adipocytes. Arrowheads indicate plasma membrane localization of GLUT4 in cells treated with insulin. Bar, 10 μm.

References

    1. Ahle S., Mann A., Eichelsbacher U., Ungewickell E. Structural relationships between clathrin assembly proteins from the Golgi and the plasma membrane. EMBO (Eur. Mol. Biol. Organ.) J. 1988;7:919–929. - PMC - PubMed
    1. Aledo J.C., Lavoie L., Volchuk A., Keller S.R., Klip A., Hundal H.S. Identification and characterization of two distinct intracellular GLUT4 pools in rat skeletal muscleevidence for an endosomal and an insulin-sensitive GLUT4 compartment. Biochem. J. 1997;325:727–732. - PMC - PubMed
    1. Balla T., Downing G.J., Jaffe H., Kim S., Zolyomi A., Catt K.J. Isolation and molecular cloning of wortmannin-sensitive bovine type III phosphatidylinositol 4-kinases. J. Biol. Chem. 1997;272:18358–18366. - PubMed
    1. Barr V.A., Malide D., Zarnowski M., Taylor S.I., Cushman S.W. Insulin stimulates both leptin secretion and production by rat white adipose tissue. Endocrinology. 1997;138:4463–4472. - PubMed
    1. Benito M., Porras A., Nebreda A., Santos E. Differentiation of 3T3-L1 fibroblasts to adipocytes induced by transfection of ras oncogenes. Science. 1991;253:565–568. - PubMed

Publication types

MeSH terms