. 1999 Aug;120(4):951-9.
doi: 10.1104/pp.120.4.951.

Hydrophobic protein synthesized in the pod endocarp adheres to the seed surface

Affiliations

Hydrophobic protein synthesized in the pod endocarp adheres to the seed surface

M Gijzen et al. Plant Physiol. 1999 Aug.

Abstract

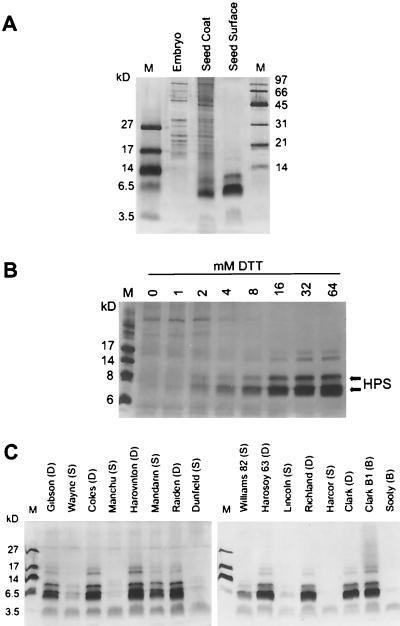
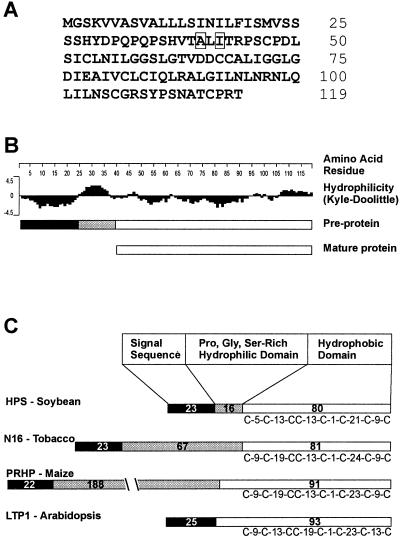
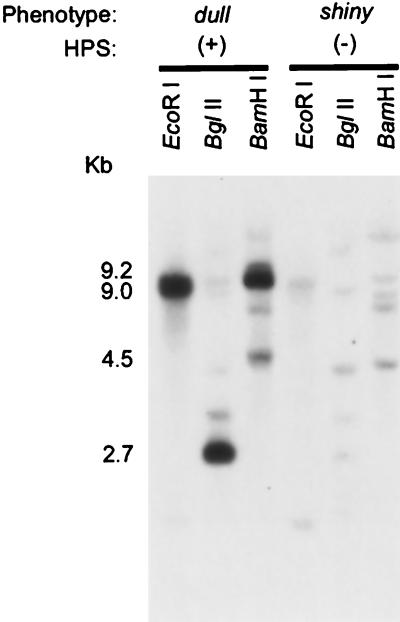
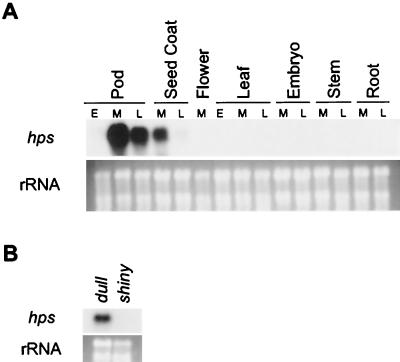
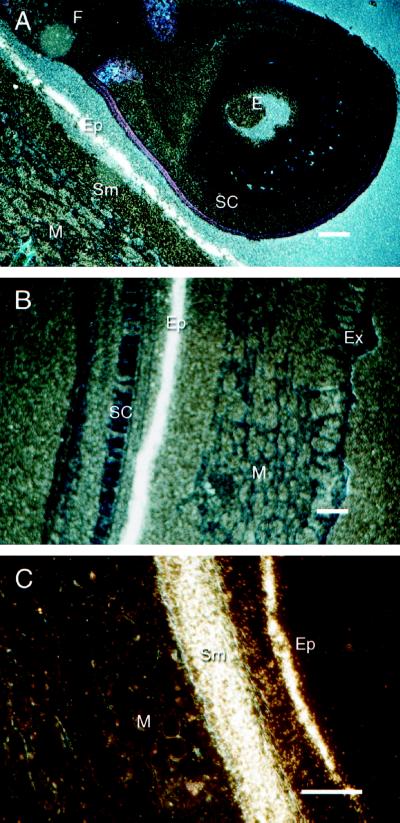
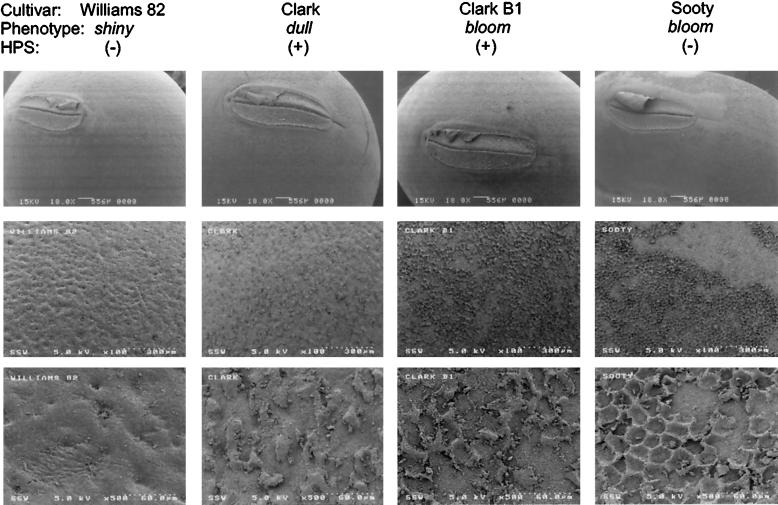
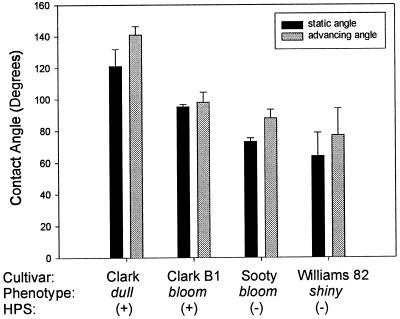
Soybean (Glycine max [L.] Merr.) hydrophobic protein (HPS) is an abundant seed constituent and a potentially hazardous allergen that causes asthma in persons allergic to soybean dust. By analyzing surface extracts of soybean seeds with sodium dodecyl sulfate-polyacrylamide gel electrophoresis and amino-terminal microsequencing, we determined that large amounts of HPS are deposited on the seed surface. The quantity of HPS present varies among soybean cultivars and is more prevalent on dull-seeded phenotypes. We have also isolated cDNA clones encoding HPS and determined that the preprotein is translated with a membrane-spanning signal sequence and a short hydrophilic domain. Southern analysis indicated that multiple copies of the HPS gene are present in the soybean genome, and that the HPS gene structure is polymorphic among cultivars that differ in seed coat luster. The pattern of HPS gene expression, determined by in situ hybridization and RNA analysis, shows that HPS is synthesized in the endocarp of the inner ovary wall and is deposited on the seed surface during development. This study demonstrates that a seed dust allergen is associated with the seed luster phenotype in soybean and that compositional properties of the seed surface may be altered by manipulating gene expression in the ovary wall.


Figures

Figure 1
Figure 1
SDS-PAGE analysis of protein extracts from seed tissues and surface. Shown are silver-stained protein gels. Lanes marked “M” indicate protein standards, and their corresponding mass in kilodaltons is provided at left. A, Soluble protein extracts from the embryo, seed coat, and seed surface of a dull phenotype (cv Harosoy 63). Each sample was approximately 1 μg of total protein. B, Seed surface protein extracts of a dull phenotype (cv Harosoy 63) with different concentrations of DTT present in the sample loading buffer, as indicated at the top of each lane. C, Seed surface protein extracts of dull (D), shiny (S), and bloom (B) phenotypes, as indicated at the top of each lane.
Figure 2
Figure 2
A, Deduced amino acid sequence of HPS preprotein. Alternate N-terminal residues, as determined by peptide microsequence analysis, are boxed. B, A Kyle-Doolittle hydrophilicity plot of HPS (LASERGENE software, DNASTAR, Madison, WI). In this plot, positive values indicate greater hydrophilic character. Also represented are the three domains of the HPS preprotein and the length of the mature peptide. C, A schematic comparison of HPS domain structure to three other plant proteins. Bold numbers indicate the length in amino acid residues for the domain segments. The pattern of spacing between the eight Cys residues within the hydrophobic domains is also shown below each protein. Sequences for the tobacco N16 polypeptide (accession no. D86629), the maize Pro-rich hydrophobic protein (PRHP) (accession no. X60432), and the Arabidopsis lipid transfer protein 1 (LTP1) (accession no. M80567) were retrieved from GenBank.
Figure 3
Figure 3
Restriction fragment length polymorphisms between dull and shiny phenotypes. Genomic DNA from dull (cv Harosoy 63) and shiny (cv Williams 82) soybeans with abundant (+) or trace (−) amounts of HPS on the seed surface was digested with restriction enzymes, electrophoretically separated, blotted, and hybridized to the HPS cDNA probe. The size of hybridizing fragments was estimated by comparison with standards and is shown on the left (in kb).
Figure 4
Figure 4
Analysis of HPS gene expression by RNA hybridization. Total RNA was isolated from leaf, flower, pod shells, seed coat, embryo, stem, or root tissue. Equal amounts of RNA (10 μg) were blotted to nylon and probed with HPS cDNA. rRNA, visualized by staining with ethidium bromide, is shown as control. A, RNA from tissues at early (E), mid (M), or late (L) stages of development were compared for HPS gene expression. All samples shown are from a dull-seeded phenotype (cv Harosoy 63). B, RNA from pod tissues of dull (cv Harosoy 63)- and shiny (cv Williams 82)-seeded soybeans were compared for HPS gene expression.
Figure 5
Figure 5
Localization of HPS mRNA transcript by in situ hybridization. Cross-sections of soybean pods containing immature seeds (dull phenotype, HPS [+], cv Maple Presto). Hybridization of 35S-labeled HPS probe to complementary mRNA appears as a bright white signal in these dark-field microscopy images. E, Embryo; Ep, inner epidermal layer of endocarp; Ex, exocarp; F, funiculus; M, mesocarp; SC, seed coat; Sm, sclerenchyma layer of endocarp. Bar = 100 μm. A, Expression at 6 DPA. B and C, Expression at 12 DPA.
Figure 6
Figure 6
SEM micrographs of seed surfaces of shiny, dull, and bloom phenotypes. Four different combinations of phenotype and HPS content (−, trace; +, abundant) are shown at three magnifications. The lowest magnifications (top micrographs) show views of the whole seeds. The large, oval-shaped scar on the seed surface is the hilum, corresponding to the point of detachment of the mature seed from the funiculus. Higher magnifications are focused outside of hilum region. Lengths of scale bars or dashed lines are indicated in micrometers. Lengths across the horizontal field of view for each of the magnifications are: 7.1 mm (top); 1.1 mm (middle); and 0.2 mm (bottom).
Figure 7
Figure 7
Surface droplet contact angles for seeds of shiny, dull, and bloom phenotypes. Four different combinations of phenotype and HPS content (−, trace; +, abundant), corresponding to the four cultivars shown in Figure 6, were compared for surface droplet contact angles. Values are means and se values for four or five independent measurements.

References

    1. Antó JM, Sunyer J, Reed CE, Sabrià J, Martínez F, Morrell F, Cordina R, Rodriguez-Roisin R, Rodrigo MJ, Roco J. Preventing asthma epidemics due to soybeans by dust-control measures. N Engl J Med. 1993;329:1760–1763. - PubMed
    1. Antó JM, Sunyer J, Rodriguez-Roisin R, Suarez-Cervera M, Vazquez L. Community outbreaks of asthma associated with inhalation of soybean dust. N Engl J Med. 1989;320:1097–1102. - PubMed
    1. Baud F, Pebay-Peyroula E, Cohen-Addad C, Odani S, Lehmann MS. Crystal structure of hydrophobic protein from soybean: a member of a new cysteine-rich family. J Mol Biol. 1993;231:877–887. - PubMed
    1. Bernard RL, Weiss MG (1973) Qualitative genetics. In BE Caldwell, ed, Soybeans: Improvement, Production, and Uses. American Society of Agronomy, Madison, WI, pp 117–154
    1. Blum H, Beier H, Gross HJ. Improved staining of plant proteins, RNA and DNA in polyacrylamide gels. Electrophoresis. 1987;8:93–99.

Publication types

MeSH terms

Associated data

LinkOut - more resources