

Characterization of white matter lesions in multiple sclerosis and traumatic brain injury as revealed by magnetization transfer contour plots
- PMID: 10445432
- PMCID: PMC7056217
Characterization of white matter lesions in multiple sclerosis and traumatic brain injury as revealed by magnetization transfer contour plots
Abstract
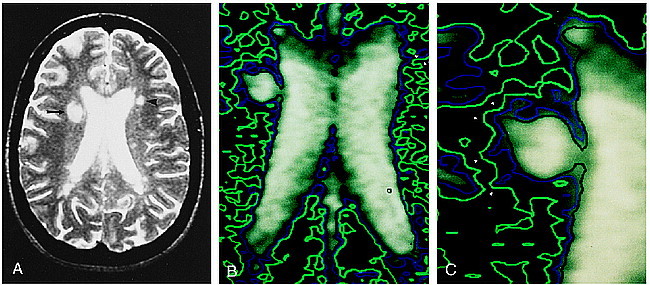
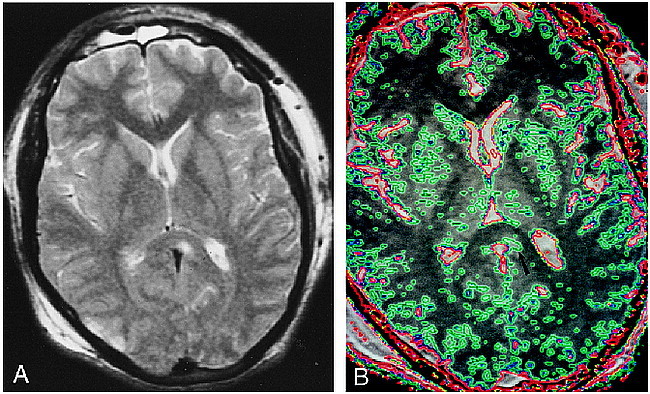
Background and purpose: Magnetization transfer imaging provides information about the structural integrity of macromolecular substances, such as myelin. Our objective was to use this imaging technique and contour plotting to characterize and to define the extent of white matter lesions in multiple sclerosis and traumatic brain injury.
Methods: Magnetization transfer imaging was performed of 30 multiple sclerosis plaques and 10 traumatic white matter lesions. Magnetization transfer ratios (MTRs) were calculated for the lesions, for the normal- or abnormal-appearing surrounding white matter, and for remote normal-appearing white matter. MTR contour plots were constructed about these lesions.
Results: The contour plot appearance of MS plaques differed from that of traumatic white matter lesions. There was a gradual increase in MTR values at points at increasing distances from the center of the MS plaques; this was true for those lesions with and without surrounding T2 signal abnormality (halos). In contrast, there was an abrupt transition in MTR values between traumatic lesions and normal-appearing surrounding white matter. Additionally, the size of the MTR abnormality exceeded the size of the T2 signal abnormality for the MS plaques.
Conclusion: MTR contour plots permit characterization and border definition of white matter lesions. Analysis of the contour plots suggests that MS is a centrifugal process with the lowest MTR within the center of the lesion. In contrast, traumatic white matter injuries are discrete lesions with abrupt transitions between the abnormal lesion and normal brain.
Figures
References
-
- Loevner LA, Grossman RI, Lexa FJ, Kessler D. Microscopic disease in normal-appearing white matter on conventional MRI in patients with multiple sclerosis: assessment with utilizing magnetization transfer measurements. Radiology 1995;196:511-515 - PubMed
-
- Filippi M, Campi A, Dousset V, et al. A magnetization transfer imaging study of normal-appearing white matter in multiple sclerosis. Neurology 1995;45:478-482 - PubMed
-
- Kasner SE, Galetta SL, McGowan JC, Grossman RI. Magnetization transfer imaging in progressive multifocal leukoencephalopathy. Neurology 1997;48:534-536 - PubMed
Publication types
MeSH terms
Grants and funding
LinkOut - more resources
Full Text Sources
Medical