. 1999 Aug;9(8):775-92.

Candidate regulatory sequence elements for cell cycle-dependent transcription in Saccharomyces cerevisiae

Affiliations

Candidate regulatory sequence elements for cell cycle-dependent transcription in Saccharomyces cerevisiae

T G Wolfsberg et al. Genome Res. 1999 Aug.

Abstract

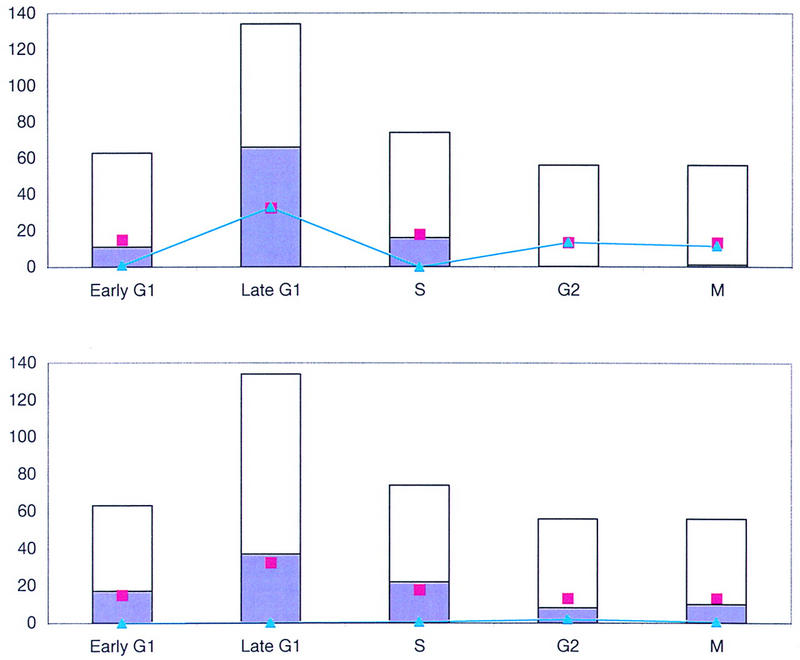
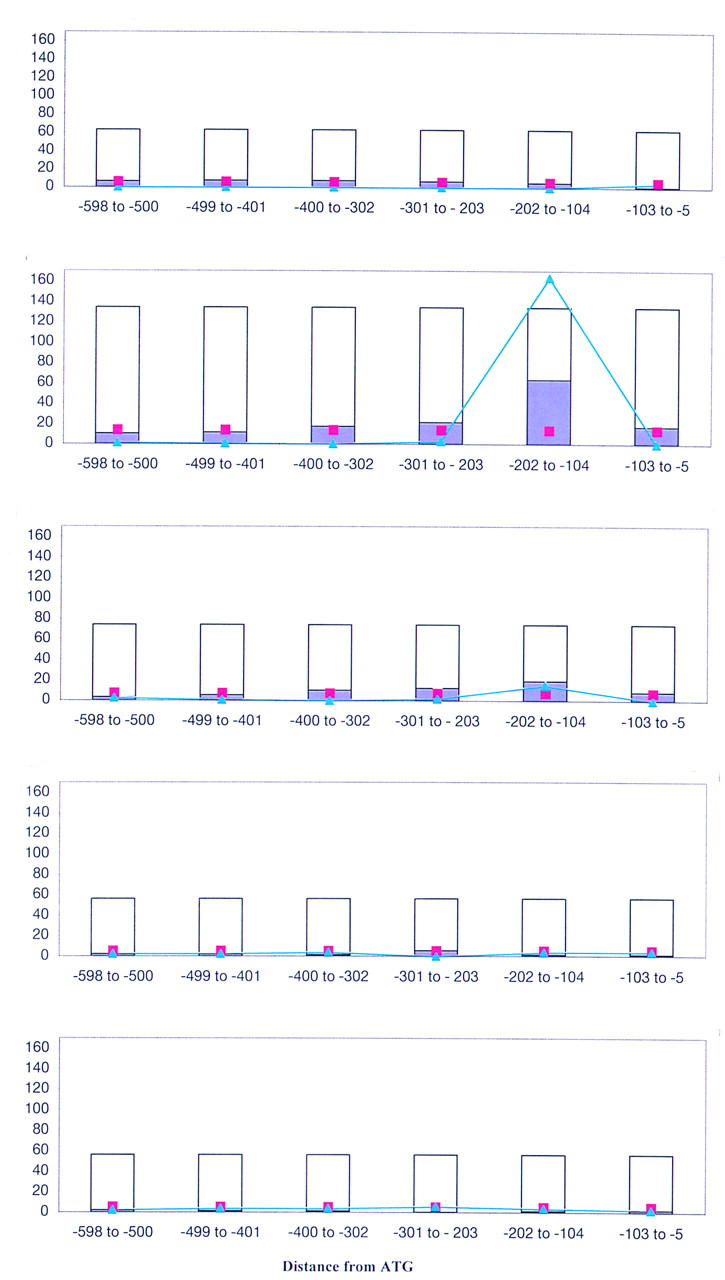
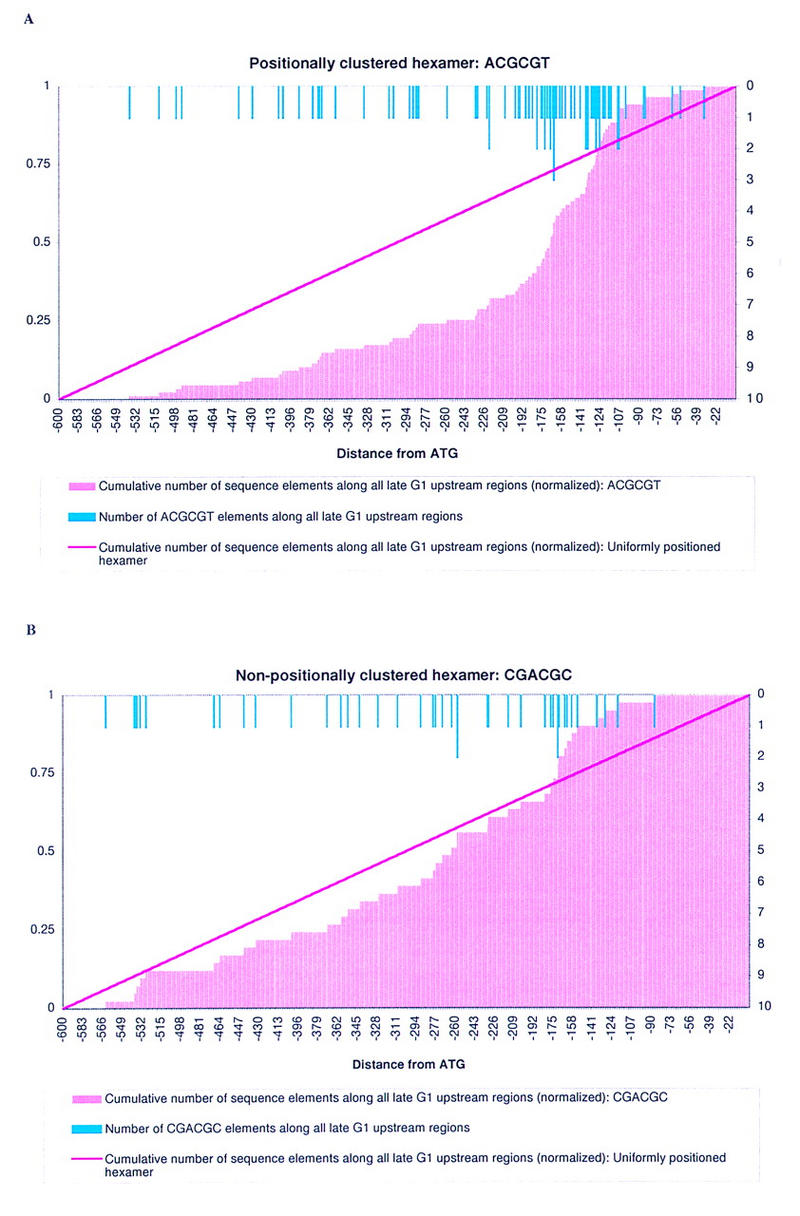
Recent developments in genome-wide transcript monitoring have led to a rapid accumulation of data from gene expression studies. Such projects highlight the need for methods to predict the molecular basis of transcriptional coregulation. A microarray project identified the 420 yeast transcripts whose synthesis displays cell cycle-dependent periodicity. We present here a statistical technique we developed to identify the sequence elements that may be responsible for this cell cycle regulation. Because most gene regulatory sites contain a short string of highly conserved nucleotides, any such strings that are involved in gene regulation will occur frequently in the upstream regions of the genes that they regulate, and rarely in the upstream regions of other genes. Our strategy therefore utilizes statistical procedures to identify short oligomers, five or six nucleotides in length, that are over-represented in upstream regions of genes whose expression peaks at the same phase of the cell cycle. We report, with a high level of confidence, that 9 hexamers and 12 pentamers are over-represented in the upstream regions of genes whose expression peaks at the early G(1), late G(1), S, G(2), or M phase of the cell cycle. Some of these sequence elements show a preference for a particular orientation, and others, through a separate statistical test, for a particular position upstream of the ATG start codon. The finding that the majority of the statistically significant sequence elements are located in late G(1) upstream regions correlates with other experiments that identified the late G(1)/early S boundary as a vital cell cycle control point. Our results highlight the importance of MCB, an element implicated previously in late G(1)/early S gene regulation, as most of the late G(1) oligomers contain the MCB sequence or variations thereof. It is striking that most MCB-like sequences localize to a specific region upstream of the ATG start codon. Additional sequences that we have identified may be important for regulation at other phases of the cell cycle.


Figures

Figure 1
Figure 1
Test for hexamers over-represented in a position-independent manner. (A) Over-represented in late G1: ACGCGT. The height of the white bar represents the number of genes in each of the five cell cycle-regulated data sets. The purple shading indicates the number of upstream regions in that data set that contain one or more copy of the oligomer. The number of upstream regions expected to contain that sequence element, if the element were evenly distributed among all five data sets, is marked with the pink box. The blue line indicates the contribution that each data set makes to the χ2 score. (B) Not over-represented in any phase: GATGTA. Ninety-four cell cycle yeast upstream regions contain one or more copy of the sequence ACGCGT, and a different set of 94 contain one or more copy of the element GATGTA. However, these elements are distributed differently among the five data sets. The element ACGCGT, which has a χ2 score of 60.4, is over-represented in late G1—the observed number of elements (purple) is greater than the expected number (pink). It is also under-represented in G2 and M, as the observed number is less than the expected number. The score in those three phases (blue) is thus higher than it is in early G1 and S. The element GATGTA, which has a χ2 score of 4.9, is not significantly over- or under-represented in any data set.
Figure 2
Figure 2
Test for pentamers over-represented in a position-dependent manner. (A) Early G1: ACGCG. The height of the white bar represents the number of genes in each interval in each data set. The purple shading indicates the number of upstream regions in that interval that contain one or more copy of the sequence element. The number of upstream regions expected to contain that sequence element, if the element were evenly distributed among all intervals in all data sets, is marked with the pink box. The blue line indicates the contribution that each interval makes to the χ2 score. (B) The pentamer ACGCG is over-represented in late G1 upstream regions in the interval −104 to −202 nucleotides upstream of the ATG start codon—the observed number of elements (purple) is greater than the expected number (pink). (C) It is somewhat over-represented in the same interval in S. The total χ2 score for ACGCG is 239.8. (D) G1: ACGCG; (E) M: ACGCG.
Figure 3
Figure 3
Test for clustered pentamers or hexamers. The light blue lines at the top represents the position of the sequence element along all upstream regions in a given data set—in this case, late G1. The scale for these blue lines is along the right axis; the scale for all other lines is along the left axis. The pink histogram is a cumulative representation of the light blue lines, i.e., it shows the (normalized) cumulative number of oligomers present at that position. The dark pink line is the expected (normalized) cumulative number of sequence elements at that position, if the element is not clustered along the upstream region. Both elements ACGCGT and CGACGC are over-represented in late G1 (Table 1). The two overlapping pentamers that make up ACGCGT, ACGCG, and CGCGT are both over-represented in late G1 in the interval from −104 to −202 nucleotides upstream of the ATG start codon (Table 2). One of the two pentamers that makes up CGACGC, GACGC, is also over-represented in late G1 in the interval from −104 to −202 nucleotides upstream of the ATG start codon (Table 2). However, although the 87 ACGCGT hexamers are clustered along late G1 upstream regions according to the statistic used here, the 41 CGACGC hexamers are not clustered. Empirically, the ACGCGT hexamers are clustered between ∼−100 and −200 nucleotides upstream of the ATG start codon.

References

    1. Brazma A, Jonassen I, Vilo J, Ukkonen E. Predicting gene regulatory elements in silico on a genomic scale. Genome Res. 1998;8:1202–1215. - PMC - PubMed
    1. Cho RJ, Campbell MJ, Winzeler EA, Steinmetz L, Conway A, Wodicka L, Wolfsberg TG, Gabrielian AE, Landsman D, Lockhart DJ, Davis RW. A genome-wide transcriptional analysis of the mitotic cell cycle. Mol Cell. 1998;2:65–73. - PubMed
    1. Chu S, DeRisi J, Eisen M, Mulholland J, Botstein D, Brown PO, Herskowitz I. The transcriptional program of sporulation in budding yeast. Science. 1998;282:699–705. - PubMed
    1. DeRisi JL, Iyer VR, Brown PO. Exploring the metabolic and genetic control of gene expression on a genomic scale. Science. 1997;278:680–686. - PubMed
    1. Fujibuchi W, Kanehisa M. Prediction of gene expression specificity by promoter sequence patterns. DNA Res. 1997;4:81–90. - PubMed

LinkOut - more resources