

Aberrant prostaglandin synthase 2 expression defines an antigen-presenting cell defect for insulin-dependent diabetes mellitus
- PMID: 10449443
- PMCID: PMC408519
- DOI: 10.1172/JCI4852
Aberrant prostaglandin synthase 2 expression defines an antigen-presenting cell defect for insulin-dependent diabetes mellitus
Abstract
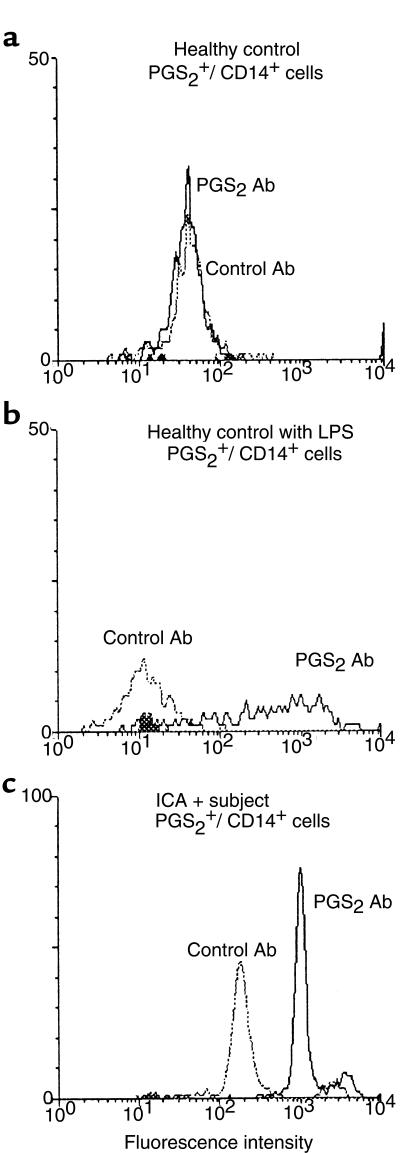
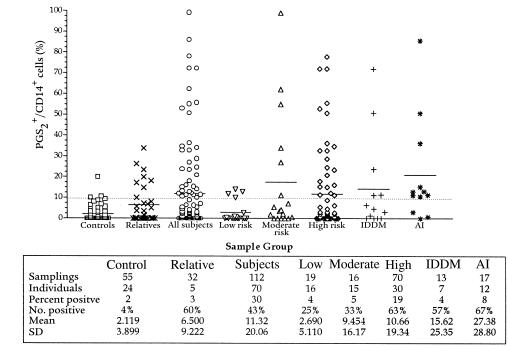
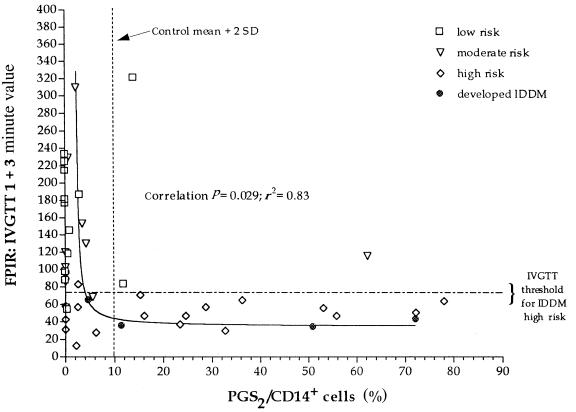
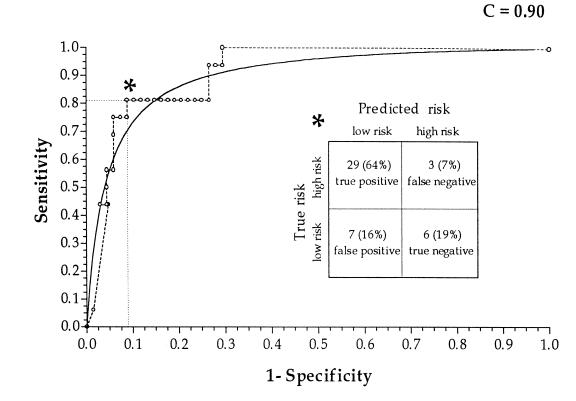
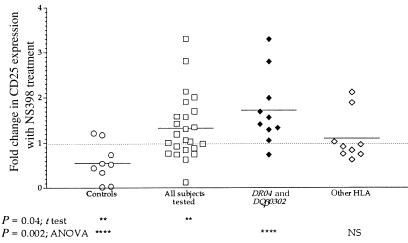
Prostaglandins (PGs) are lipid molecules that profoundly affect cellular processes including inflammation and immune response. Pathways contributing to PG output are highly regulated in antigen-presenting cells such as macrophages and monocytes, which produce large quantities of these molecules upon activation. In this report, we demonstrate aberrant constitutive expression of the normally inducible cyclooxygenase PG synthase 2 (PGS(2)/ COX-2) in nonactivated monocytes of humans with insulin-dependent diabetes mellitus (IDDM) and those with islet autoantibodies at increased risk of developing this disease. Constitutive PGS(2) appears to characterize a high risk for diabetes as it correlates with and predicts a low first-phase insulin response in autoantibody-positive subjects. Abnormal PGS(2) expression in at-risk subjects affected immune response in vitro, as the presence of a specific PGS(2) inhibitor, NS398, significantly increased IL-2 receptor alpha-chain (CD25) expression on phytohemagglutinin-stimulated T cells. The effect of PGS(2) on CD25 expression was most profound in subjects expressing both DR04 and DQbeta0302 high-risk alleles, suggesting that this cyclooxygenase interacts with diabetes-associated MHC class II antigens to limit T-cell activation. These results indicate that constitutive PGS(2) expression in monocytes defines an antigen-presenting cell defect affecting immune response, and that this expression is a novel cell-associated risk marker for IDDM.
Figures
Similar articles
-
Aberrant monocyte prostaglandin synthase 2 (PGS2) expression in type 1 diabetes before and after disease onset.Pediatr Diabetes. 2003 Mar;4(1):10-8. doi: 10.1034/j.1399-5448.2003.00042.x. Pediatr Diabetes. 2003. PMID: 14655518
-
Effect of constitutive- and inducible-cyclooxygenase in the carbachol-induced pituitary-adrenocortical response during social stress.J Physiol Pharmacol. 2002 Sep;53(3):453-62. J Physiol Pharmacol. 2002. PMID: 12369741
-
Inhibition of human glioma cell growth by a PHS-2 inhibitor, NS398, and a prostaglandin E receptor subtype EP1-selective antagonist, SC51089.J Neurooncol. 2004 Feb;66(3):285-92. doi: 10.1023/b:neon.0000014537.15902.73. J Neurooncol. 2004. PMID: 15015658
-
Prostaglandins regulate melanoma-induced cytokine production in macrophages.Cell Immunol. 2000 Sep 15;204(2):143-9. doi: 10.1006/cimm.2000.1686. Cell Immunol. 2000. PMID: 11069722
-
Autoimmune diabetes: the role of T cells, MHC molecules and autoantigens.Autoimmunity. 1998;27(3):159-77. doi: 10.3109/08916939809003864. Autoimmunity. 1998. PMID: 9609134 Review.
Cited by
-
Drug repositioning for diabetes based on 'omics' data mining.PLoS One. 2015 May 6;10(5):e0126082. doi: 10.1371/journal.pone.0126082. eCollection 2015. PLoS One. 2015. PMID: 25946000 Free PMC article.
-
Selecting culprits in type 1 diabetes beta-cell killing.J Clin Invest. 1999 Dec;104(11):1487-9. doi: 10.1172/JCI8826. J Clin Invest. 1999. PMID: 10587509 Free PMC article. No abstract available.
-
A psychoneuroimmunological perspective to Emil Kraepelins dichotomy: schizophrenia and major depression as inflammatory CNS disorders.Eur Arch Psychiatry Clin Neurosci. 2008 Jun;258 Suppl 2:97-106. doi: 10.1007/s00406-008-2012-3. Eur Arch Psychiatry Clin Neurosci. 2008. PMID: 18516521 Review.
-
Altered monocyte cyclo-oxygenase response in non-obese diabetic mice.Clin Exp Immunol. 2009 Feb;155(2):304-10. doi: 10.1111/j.1365-2249.2008.03825.x. Epub 2008 Nov 24. Clin Exp Immunol. 2009. PMID: 19040607 Free PMC article.
-
Effects of vitamin A, C and E, or omega-3 fatty acid supplementation on the level of paraoxonase and arylesterase activity in streptozotocin-induced diabetic rats: an investigation of activities in plasma, and heart and liver homogenates.Singapore Med J. 2016 Mar;57(3):153-6. doi: 10.11622/smedj.2015102. Singapore Med J. 2016. PMID: 26996784 Free PMC article.
References
-
- Ashton-Richardt PG, et al. Evidence of a differential avidity model of T cell selection in the thymus. Cell. 1994;76:651–663. - PubMed
-
- Sebzda E, et al. Positive and negative thymocyte selection induced by different concentrations of a single peptide. Science. 1994;263:1615–1618. - PubMed
-
- Rocha B, von Boehemer H. Peripheral selection of the T cell repertoire. Science. 1991;251:1225–1231. - PubMed
-
- Zhang L, Martin DR, Fung-Leung W-P, Te H-S, Miller RG. Peripheral deletion of mature CD8+ antigen specific T cells after in vivo exposure to male antigen. J Immunol. 1992;148:1538–1592. - PubMed
-
- Ucker DS, Meyers J, Obermiller PS. Activation-driven T cell death. II. Quantitative differences alone distinguish stimuli triggering nontransformed T cell proliferation or death. J Immunol. 1993;149:1583–1592. - PubMed
Publication types
MeSH terms
Substances
Grants and funding
LinkOut - more resources
Full Text Sources
Other Literature Sources
Medical
Research Materials
