. 1999 Aug 16;190(4):479-86.
doi: 10.1084/jem.190.4.479.

Direct evidence for thymic function in adult humans

Affiliations

Direct evidence for thymic function in adult humans

J F Poulin et al. J Exp Med. .

Abstract

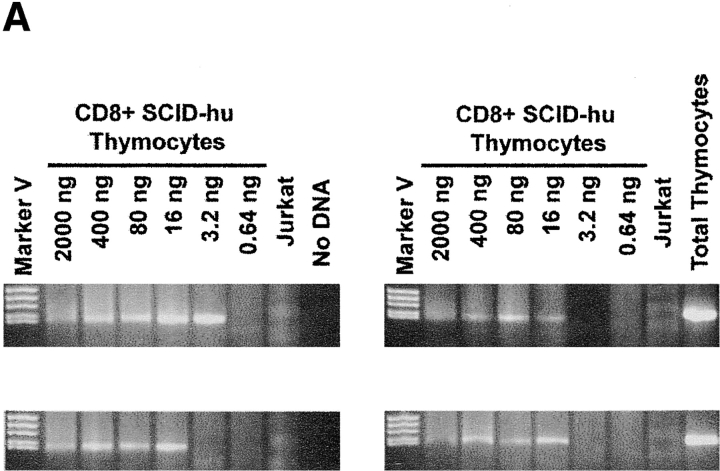
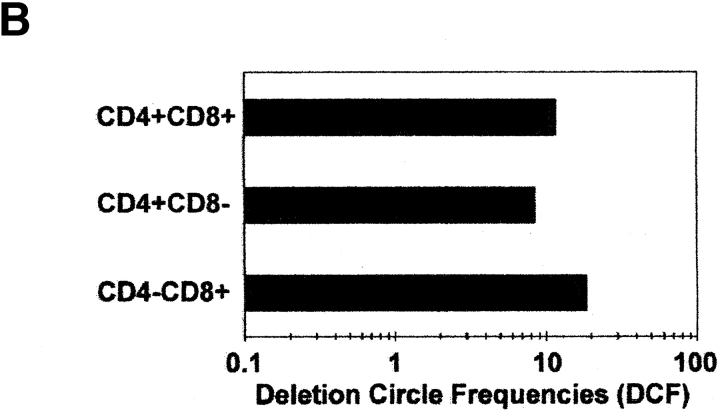
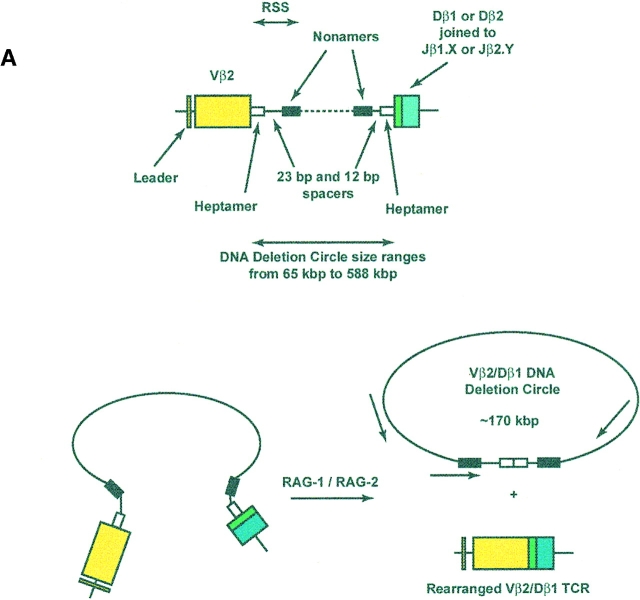
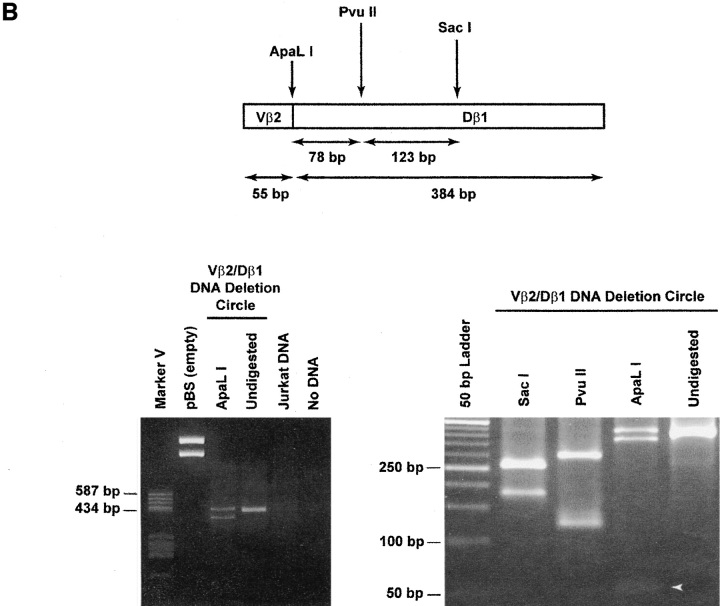
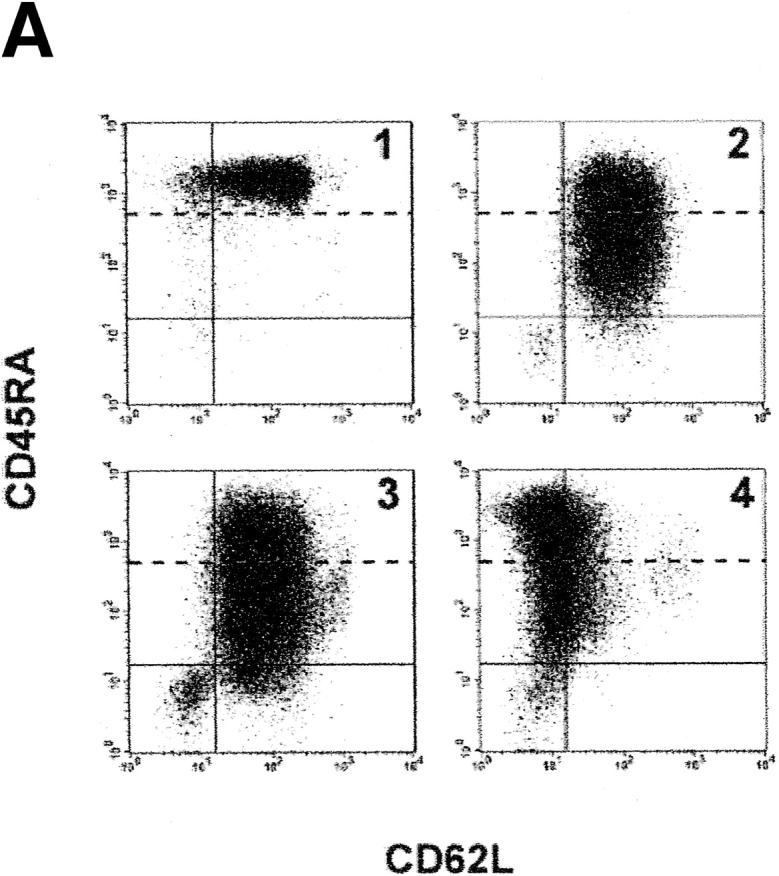
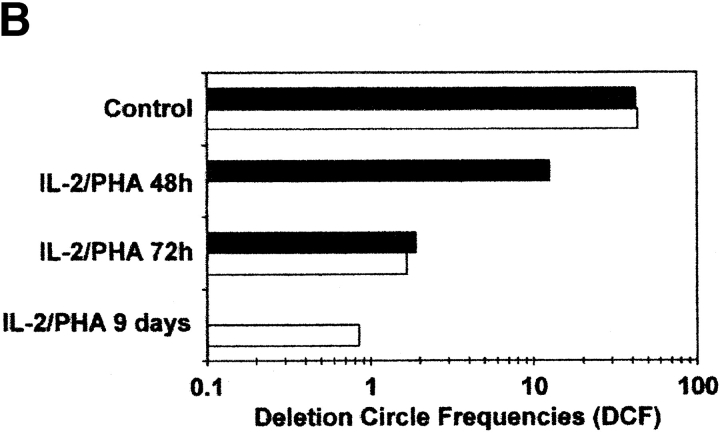
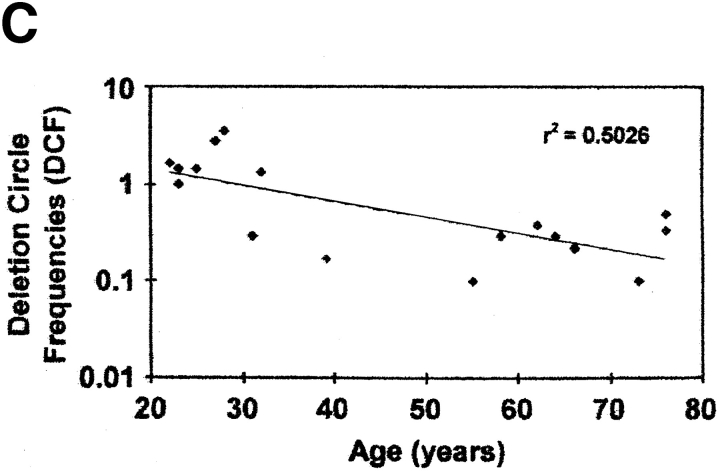
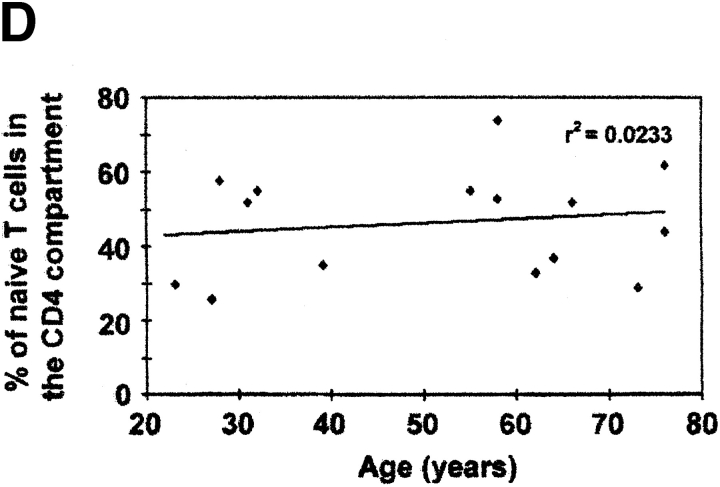
The understanding of human thymic function and evaluation of its contribution to T cell homeostasis are matters of great importance. Here we report the development of a novel assay to quantitate the frequency and diversity of recent thymic emigrants (RTEs) in the peripheral blood of humans. Such cells were defined by the presence of T cell receptor (TCR) rearrangement deletion circles (DCs), episomal byproducts of TCR-beta V(D)J rearrangement. DCs were detected in T cells in the thymus, cord blood, and adult peripheral blood. In the peripheral blood of adults aged 22 to 76 years, their frequency was highest in the CD4(+)CD45RA(+) CD62L(+) subpopulation of naive T cells. TCR DCs were also observed in other subpopulations of peripheral blood T cells, including those with the CD4(+)CD45RO(-)CD62L(+) and CD4(+)CD45RO(+)CD62L(+) phenotypes. RTEs were observed to have more than one Vbeta rearrangement, suggesting that replenishment of the repertoire in the adult is at least oligoclonal. These results demonstrate that the normal adult thymus continues to contribute, even in older individuals, a diverse set of new T cells to the peripheral circulation.


Figures

Figure 2
Figure 2
Quantitation of TCR rearrangement DCs. (A) Representative example of endpoint dilution analysis of DCs within CD3+CD8+ human thymocytes. Starting at 2,000 ng of input DNA per well, quadruplicate fivefold serial dilutions were subjected to the nested PCR approach shown in Fig. 1. DNA from Jurkat cells (150 ng) and from total thymocytes (150 ng) served as negative and positive controls, respectively. (B) Relative frequencies of Vβ2/Dβ1 DCs in sort-purified populations of CD4+CD8+, CD3+CD4+CD8, and CD3+CD4CD8+ human thymocytes.
Figure 2
Figure 2
Quantitation of TCR rearrangement DCs. (A) Representative example of endpoint dilution analysis of DCs within CD3+CD8+ human thymocytes. Starting at 2,000 ng of input DNA per well, quadruplicate fivefold serial dilutions were subjected to the nested PCR approach shown in Fig. 1. DNA from Jurkat cells (150 ng) and from total thymocytes (150 ng) served as negative and positive controls, respectively. (B) Relative frequencies of Vβ2/Dβ1 DCs in sort-purified populations of CD4+CD8+, CD3+CD4+CD8, and CD3+CD4CD8+ human thymocytes.
Figure 1
Figure 1
Formation and detection of TCR-β rearrangement DCs. (A) Top: genomic organization of the region including the Vβ2 and Dβ1 coding segments, flanked by heptamer and nonamer RSS and 170 kbp of intervening noncoding DNA. Bottom: generation of a rearranged Vβ2/Dβ1 coding TCR and a 170-kbp Vβ2/Dβ1 DC after excision–ligation mediated by RAG-1 and RAG-2. The relative location and orientation of the primers used for amplification of the unique signal joint are shown. Note that DCs will have various sizes (from 65 to 588 kbp) depending on the Vβ-Dβ usage. (B) Top: map of the amplified 439-bp Vβ2/Dβ1 PCR product. Bottom: representative example of Vβ2/Dβ1 DC products amplified from CD4+CD8+ human thymocytes or from Jurkat cells. The left gel shows the specificity of the amplification; note the absence of products in both the Jurkat and “no DNA” lanes. The PCR product is partially cleavable by ApaLI, likely due to heterogeneity of nucleotide sequence at the circle junction. An ApaLI digestion-positive control was performed at the same time on an empty pBS vector, resulting in complete digestion. The right gel shows restriction analysis of the purified 439-bp Vβ2/Dβ1 DC product, with characteristic cuts by SacI, PvuII, and ApaLI. White arrow, 55-bp fragment released by ApaLI digestion.
Figure 1
Figure 1
Formation and detection of TCR-β rearrangement DCs. (A) Top: genomic organization of the region including the Vβ2 and Dβ1 coding segments, flanked by heptamer and nonamer RSS and 170 kbp of intervening noncoding DNA. Bottom: generation of a rearranged Vβ2/Dβ1 coding TCR and a 170-kbp Vβ2/Dβ1 DC after excision–ligation mediated by RAG-1 and RAG-2. The relative location and orientation of the primers used for amplification of the unique signal joint are shown. Note that DCs will have various sizes (from 65 to 588 kbp) depending on the Vβ-Dβ usage. (B) Top: map of the amplified 439-bp Vβ2/Dβ1 PCR product. Bottom: representative example of Vβ2/Dβ1 DC products amplified from CD4+CD8+ human thymocytes or from Jurkat cells. The left gel shows the specificity of the amplification; note the absence of products in both the Jurkat and “no DNA” lanes. The PCR product is partially cleavable by ApaLI, likely due to heterogeneity of nucleotide sequence at the circle junction. An ApaLI digestion-positive control was performed at the same time on an empty pBS vector, resulting in complete digestion. The right gel shows restriction analysis of the purified 439-bp Vβ2/Dβ1 DC product, with characteristic cuts by SacI, PvuII, and ApaLI. White arrow, 55-bp fragment released by ApaLI digestion.
Figure 3
Figure 3
Detection of TCR rearrangement DCs in human peripheral blood T cells. (A) Representative flow cytograms of CD4+ human cord blood T cells that were unstimulated (panel 1) or stimulated for varying time intervals (panel 2, 72 h; panel 3, 96 h; panel 4, 9 d) with IL-2 (10 U/ml) and PHA (5 μg/ml). CD4+ T cells at each time point were gated and subdivided by staining for CD45RA and CD62L. Based on the staining of cells for CD45RA before stimulation (panel 1), cells were designated as CD45RAbright or CD45RAdim (with fluorescence intensities above and below the dotted lines, respectively). (B) Relative frequency of Vβ2/Dβ1 DCs in cord blood T cells that were unstimulated (control) or stimulated for varying time intervals with PHA and IL-2. Black bars, results from one experiment with endpoints at 48 and 72 h; white bars, results from a second experiment (different cord blood donor) with endpoints at 72 h and 9 d. (C) Correlation between increasing age and decreasing frequency of Vβ2/Dβ1 DCs in the circulating CD4+CD45RA+CD62L+ T cell subpopulation (P = 0.0045). Sort-purified CD4+CD45RA+CD62L+ human peripheral blood T cells were isolated from individuals of the indicated ages and analyzed for Vβ2/Dβ1 DCs. Such DCs were absent from the CD4+CD45RO+CD62L subpopulations of each individual (not shown). The point at 55 yr old was scored as “undetectable” in the assay (i.e., with a DCF value ≤0.1). (D) Percentages of circulating naive (CD45RA+CD62L+) CD4+ T cells in the peripheral blood as a function of age. No correlation exists between age and the frequency of such naive CD4+ T cells (P = 0.5123).
Figure 3
Figure 3
Detection of TCR rearrangement DCs in human peripheral blood T cells. (A) Representative flow cytograms of CD4+ human cord blood T cells that were unstimulated (panel 1) or stimulated for varying time intervals (panel 2, 72 h; panel 3, 96 h; panel 4, 9 d) with IL-2 (10 U/ml) and PHA (5 μg/ml). CD4+ T cells at each time point were gated and subdivided by staining for CD45RA and CD62L. Based on the staining of cells for CD45RA before stimulation (panel 1), cells were designated as CD45RAbright or CD45RAdim (with fluorescence intensities above and below the dotted lines, respectively). (B) Relative frequency of Vβ2/Dβ1 DCs in cord blood T cells that were unstimulated (control) or stimulated for varying time intervals with PHA and IL-2. Black bars, results from one experiment with endpoints at 48 and 72 h; white bars, results from a second experiment (different cord blood donor) with endpoints at 72 h and 9 d. (C) Correlation between increasing age and decreasing frequency of Vβ2/Dβ1 DCs in the circulating CD4+CD45RA+CD62L+ T cell subpopulation (P = 0.0045). Sort-purified CD4+CD45RA+CD62L+ human peripheral blood T cells were isolated from individuals of the indicated ages and analyzed for Vβ2/Dβ1 DCs. Such DCs were absent from the CD4+CD45RO+CD62L subpopulations of each individual (not shown). The point at 55 yr old was scored as “undetectable” in the assay (i.e., with a DCF value ≤0.1). (D) Percentages of circulating naive (CD45RA+CD62L+) CD4+ T cells in the peripheral blood as a function of age. No correlation exists between age and the frequency of such naive CD4+ T cells (P = 0.5123).

Similar articles

Cited by

References

    1. Mackall C.L., Hakim F.T., Gress R.E. T-cell regenerationall repertoires are not created equal. Immunol. Today. 1997;18:245–251. - PubMed
    1. McCune J.M. Thymic function in HIV-1 disease. Semin. Immunol. 1997;9:397–404. - PubMed
    1. Kong F., Chen C.H., Cooper M.D. Thymic function can be accurately monitored by the level of recent T cell emigrants in the circulation. Immunity. 1998;8:97–104. - PubMed
    1. Scollay R.G., Butcher E.C., Weissman I.L. Thymus cell migration. Quantitative aspects of cellular traffic from the thymus to the periphery in mice. Eur. J. Immunol. 1980;10:210–218. - PubMed
    1. Steinmann G.G. Changes in the human thymus during aging. In: Muller-Hermelink H.K., editor. The Human Thymus—Histopathology and Pathology. Springer-Verlag New York, Inc.; New York, New York: 1986. pp. 43–48.

Publication types