. 1999 Aug 17;96(17):9491-6.
doi: 10.1073/pnas.96.17.9491.

Structure-based design of Taq DNA polymerases with improved properties of dideoxynucleotide incorporation

Affiliations

Structure-based design of Taq DNA polymerases with improved properties of dideoxynucleotide incorporation

Y Li et al. Proc Natl Acad Sci U S A. .

Abstract

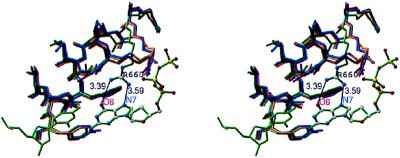
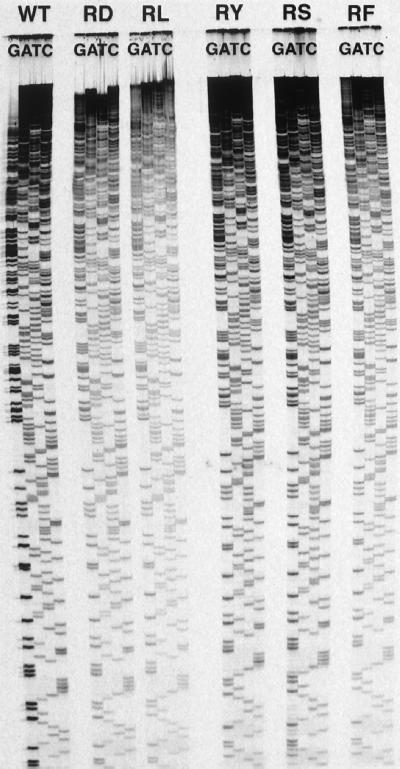
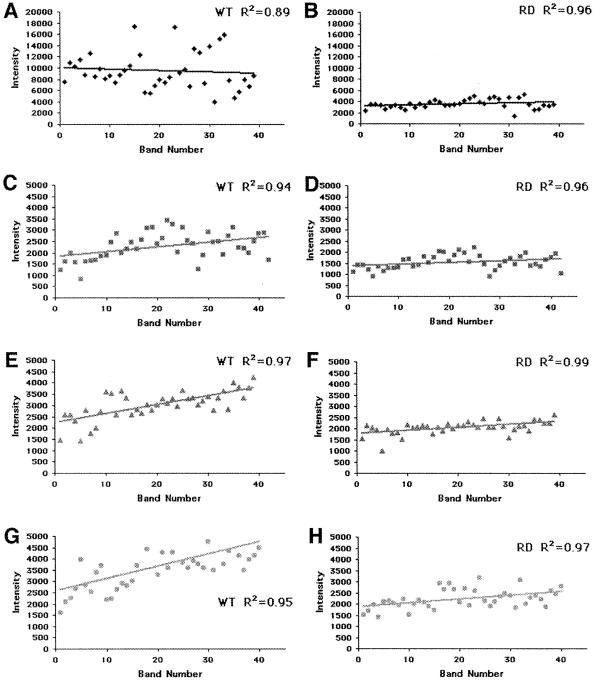
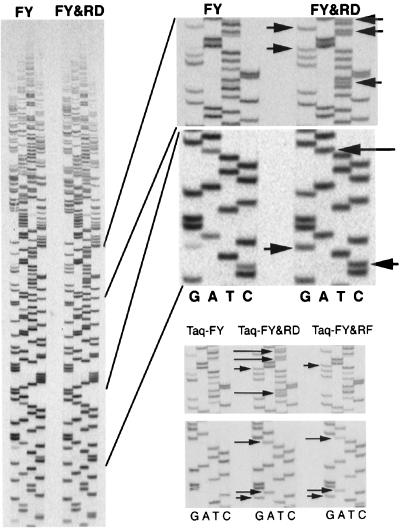
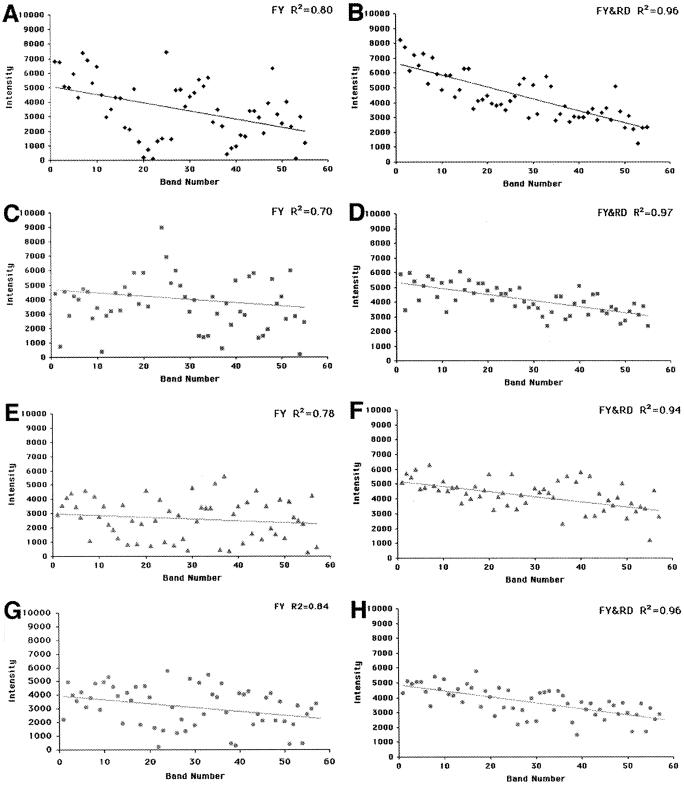
The Taq DNA polymerase is the most commonly used enzyme in DNA sequencing. However, all versions of Taq polymerase are deficient in two respects: (i) these enzymes incorporate each of the four dideoxynucleoside 5' triphosphates (ddNTPs) at widely different rates during sequencing (ddGTP, for example, is incorporated 10 times faster than the other three ddNTPs), and (ii) these enzymes show uneven band-intensity or peak-height patterns in radio-labeled or dye-labeled DNA sequence profiles, respectively. We have determined the crystal structures of all four ddNTP-trapped closed ternary complexes of the large fragment of the Taq DNA polymerase (Klentaq1). The ddGTP-trapped complex structure differs from the other three ternary complex structures by a large shift in the position of the side chain of residue 660 in the O helix, resulting in additional hydrogen bonds being formed between the guanidinium group of this residue and the base of ddGTP. When Arg-660 is mutated to Asp, Ser, Phe, Tyr, or Leu, the enzyme has a marked and selective reduction in ddGTP incorporation rate. As a result, the G track generated during DNA sequencing by these Taq polymerase variants does not terminate prematurely, and higher molecular-mass G bands are detected. Another property of these Taq polymerase variants is that the sequencing patterns produced by these enzymes are remarkably even in band-intensity and peak-height distribution, thus resulting in a significant improvement in the accuracy of DNA sequencing.


Figures

Figure 1
Figure 1
Stereo diagram of the interactions between the side chain of Arg-660 and the incoming base. In the protein, only the O helix is represented and is colored in red, gold, dark blue, and dark green for the ddCTP-, ddATP-, ddTTP-, and ddGTP-trapped complexes, respectively. In the DNA, only the dCMP/ddGTP pair is represented and is colored in green. H-bond interactions between Arg-660 and the O6 and N7 atoms in the base of the ddGTP are indicated by lines. Distances between atoms involved in H-bonds are indicated.
Figure 2
Figure 2
Comparison of DNA sequencing by Taq-WT, Taq-RD, Taq-RL, Taq-RY, Taq-RS, and Taq-RF. The enzymes used for sequencing are indicated above the corresponding sequences.
Figure 3
Figure 3
Comparison of band intensities in all tracks resulting from sequencing by Taq-WT and Taq-RD. The intensities (in relative fluorescence units) of bands in each track of the sequencing gel presented in Fig. 2 are reported directly as a function of the band number. (A, C, E, and G) Quantification of bands sequenced by Taq-WT. (B, D, F, and H) Quantification of the bands sequenced by Taq-RD. ♦, ddGTP; ■, ddATP; ▴, ddTTP; ●, ddCTP. The solid line through the data is the result of a linear regression fit through the data points. R2 values are reported for each panel. Because band intensities in the G track generated by Taq-WT are significantly higher than they are in the other tracks, intensity scales in A and B are different from those reported in the other panels.
Figure 4
Figure 4
DNA sequencing by the Taq-FY, Taq-FY&RD, and Taq-FY&RF polymerases. (Left) The full sequencing gel used to assay Taq-FY and Taq-FY&RD is shown. The two Upper Right panels are zoom-up panels showing details of the sequencing gel at Left. The two Lower Right panels are zoom-up panels of the same regions of a gel on which Taq-FY, Taq-FY&RD, and Taq-FY&RF were assayed. Arrows indicate the location of bands that are detected better when Taq-FY&RD or Taq-FY&RF are used.
Figure 5
Figure 5
Comparison between Taq-FY and Taq-FY&RD. Intensities (in relative fluorescence units) of the bands in the gel presented in Fig. 4 were measured. These values are plotted as a function of band number. (A, C, E, and G) Quantification of bands sequenced by Taq-FY. (B, D, F, and H) Quantification of the bands sequenced by Taq-FY&RD. ♦, ddGTP; ■, ddATP; ▴, ddTTP; ●, ddCTP. The solid line through the data is the result of a linear regression fit through the data points. R2 values are reported for each panel.

References

    1. Saiki R K, Gelfand D H, Stoffel S, Scharf S J, Higuchi R, Horn G T, Mullis K B, Erlich H A. Science. 1988;239:487–491. - PubMed
    1. Innis M A, Myambo K B, Gelfand D H, Brow M A D. Proc Natl Acad Sci USA. 1988;85:9436–9440. - PMC - PubMed
    1. Lee L G, Connell C R, Woo S L, Cheng R D, McArdie B F, Fuller C W, Halloran N D, Wilson R K. Nucleic Acids Res. 1992;20:2471–2483. - PMC - PubMed
    1. Brandis J W, Edwards S G, Johnson K A. Biochemistry. 1996;35:2189–2200. - PubMed
    1. Tabor S, Richardson C C. Proc Natl Acad Sci USA. 1995;92:6339–6343. - PMC - PubMed

Publication types

MeSH terms

Substances