. 1999 Aug 17;96(17):9602-6.
doi: 10.1073/pnas.96.17.9602.

Imaging of thermal activation of actomyosin motors

Affiliations

Imaging of thermal activation of actomyosin motors

H Kato et al. Proc Natl Acad Sci U S A. .

Abstract

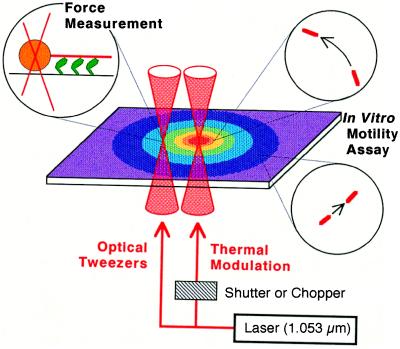
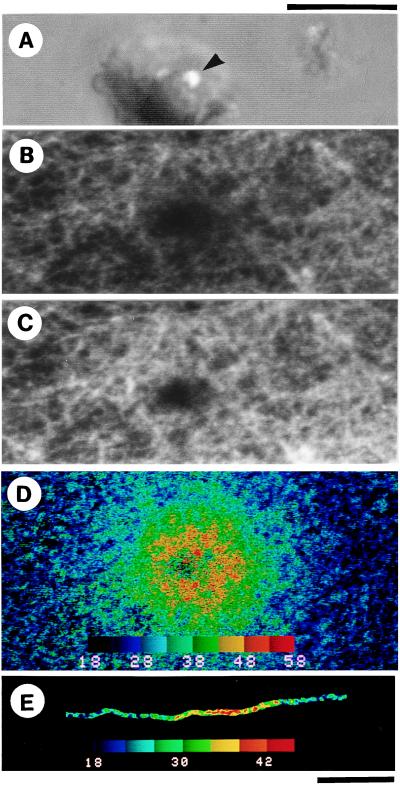
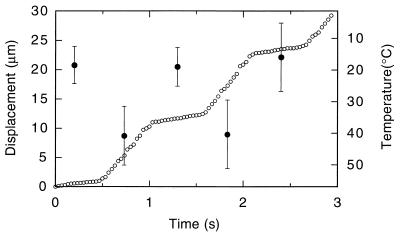
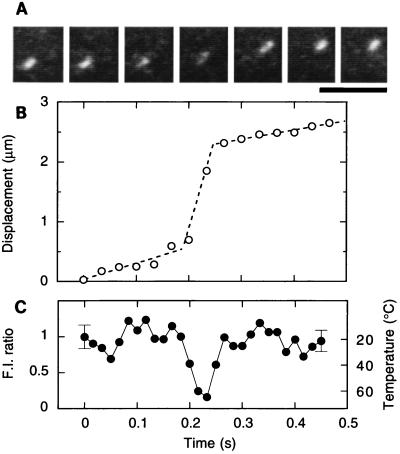
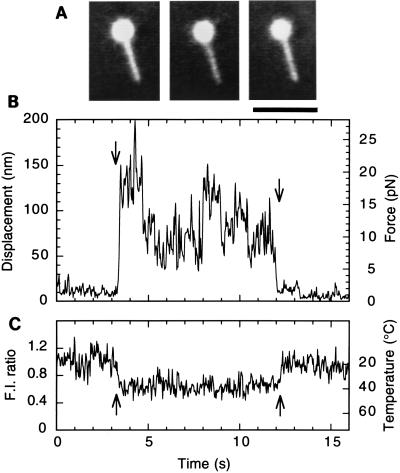
We have developed temperature-pulse microscopy in which the temperature of a microscopic sample is raised reversibly in a square-wave fashion with rise and fall times of several ms, and locally in a region of approximately 10 micrometers in diameter with a temperature gradient up to 2 degrees C/micrometers. Temperature distribution was imaged pixel by pixel by image processing of the fluorescence intensity of rhodamine phalloidin attached to (single) actin filaments. With short pulses, actomyosin motors could be activated above physiological temperatures (higher than 60 degrees C at the peak) before thermally induced protein damage began to occur. When a sliding actin filament was heated to 40-45 degrees C, the sliding velocity reached 30 micrometers/s at 25 mM KCl and 50 micrometers/s at 50 mM KCl, the highest velocities reported for skeletal myosin in usual in vitro assay systems. Both the sliding velocity and force increased by an order of magnitude when heated from 18 degrees C to 40-45 degrees C. Temperature-pulse microscopy is expected to be useful for studies of biomolecules and cells requiring temporal and/or spatial thermal modulation.


Figures

Figure 1
Figure 1
Schematic illustration of TPM system. Metal aggregates of irregular shape and several to 10 μm in size, lumps of metal particles of 0.1–1.0 μm in diameter, are scattered on a glass coverslip in an in vitro motility assay system under an optical microscope. A peripheral, not the central, portion of one of the aggregates is illuminated by focusing an IR laser beam. If the central portion is illuminated, the aggregate is frequently blown off or the surrounding medium gets boiled. The metal aggregate that absorbs the laser light functions as a local heat source, around which a concentric temperature gradient is formed. Sliding movement of actin filaments occurs at temperature-dependent velocities, as illustrated by movement in circles. When tension is measured, the incident laser beam is split into two; one constitutes optical tweezers that hold a polystyrene bead attached at the rear end of an actin filament, and the other illuminates a metal aggregate. For repetitive temperature modulation, a chopper or shutter is used.
Figure 2
Figure 2
Imaging of temperature distribution on actin filaments around the metal aggregate. (A) Phase-contrast image corresponding to the central part of fluorescence images (BD). A laser beam was focused at a periphery (shown by an arrowhead) of a lump of Al particles of irregular shape. (BD) Fluorescence images of a two-dimensional network of rhodamine phalloidin-labeled actin filaments (12 μg/ml) attached to heavy meromyosin molecules that adhered to the glass surface coated with nitrocellulose (24). Excess actin filaments were washed away, so that filaments were mostly in focus and thus within 1 μm of the glass surface. (B) Fluorescence image of the actin network taken in a single video frame coincident with laser illumination for 1/30 s under shutter control. A periphery of a ≈10-μm lump of Al particles observed in A was illuminated. Fluorescence under and close to the metal aggregate disappeared because of excessively high temperature. (C) A single-frame fluorescence image obtained two video frames after B; the image was indistinguishable from that obtained before laser illumination at 18°C ± 1°C, i.e., temperature of the coverslip. (D) Two-dimensional temperature distribution constructed from the ratio of the fluorescence intensities of the images B and C. (E) Temperature distribution on a single actin filament; only in this micrograph, the background fluorescence intensity was subtracted. In D and E, the temperature is scaled in pseudocolor as shown in color bars in °C unit. (Scale bars: upper one for AD, lower one for E, 10 μm.)
Figure 3
Figure 3
Time course showing reversible changes in the sliding movement of an actin filament with repetitive temperature pulses. Displacement of the centroid of the fluorescence image of the actin filament (1.0 μm long) is shown by ○ every 1/30 s. A laser pulse of 0.53-s duration was given every 1.07 s. The temperature was estimated from the average intensity of the actin filament in each frame at 30 frames/s. ● and error bars show the average ± SD for 14 consecutive frames (0.47 s). The coverslip temperature was kept at 18°C ± 1°C.
Figure 4
Figure 4
Time course showing a reversible change in the sliding movement of an actin filament with a single temperature pulse. (A) Snapshots of a sliding actin filament (1.1 μm long) at 1/30-s intervals. A laser pulse of 1/16-s duration was given halfway at 0.19 s. (Scale bar, 5 μm.) (B) Time course of sliding movement of the actin filament; displacement of the centroid of the fluorescence image of the actin filament is shown by ○. (C) The temperature estimated from the average intensity of the filament at 1/60-s intervals. In this particular case, odd and even fields of interlaced images were analyzed separately. The coverslip temperature was kept at 18°C ± 1°C.
Figure 5
Figure 5
Tension response of a single actin filament to a temperature pulse. (A) Fluorescence image of a bead-tailed actin filament (3.7 μm long) obtained by averaging 15 video frames for 0.5 s before, during, and after the temperature pulse, respectively, from left to right. The bead was coated with rhodamine-labeled BSA (23). The bead brightness is clipped in the central portion. (Scale bar, 5 μm.) (B) Time course of tension generation (displacement of the bead); a shutter for laser illumination was opened and closed at the times indicated by the left and right arrows, respectively. (C) Temperature was estimated from the fluorescence intensity profile obtained at the middle portion of the actin filament during the laser illumination and was 40°C ± 5°C (estimated by averaging the fluorescence intensity over 0.5 s). Only in this case, the fluorescence intensity gradually decreased with photobleaching because of prolonged laser illumination. The coverslip temperature was kept at 18°C ± 1°C.

References

    1. Funatsu T, Harada Y, Tokunaga M, Saito K, Yanagida T. Nature (London) 1995;374:555–559. - PubMed
    1. Sase I, Miyata H, Corrie J E T, Craik J S, Kinosita K., Jr Biophys J. 1995;69:323–328. - PMC - PubMed
    1. Sase I, Miyata H, Ishiwata S, Kinosita K., Jr Proc Natl Acad Sci USA. 1997;94:5646–5650. - PMC - PubMed
    1. Ishijima A, Kojima H, Funatsu T, Tokunaga M, Higuchi H, Tanaka H, Yanagida T. Cell. 1998;92:161–171. - PubMed
    1. Svoboda K, Schmidt C F, Schnapp B J, Block S M. Nature (London) 1993;365:721–727. - PubMed

Publication types

LinkOut - more resources