. 1999 Aug 17;96(17):9607-12.
doi: 10.1073/pnas.96.17.9607.

The 3D NOESY-[(1)H,(15)N,(1)H]-ZQ-TROSY NMR experiment with diagonal peak suppression

Affiliations

The 3D NOESY-[(1)H,(15)N,(1)H]-ZQ-TROSY NMR experiment with diagonal peak suppression

K V Pervushin et al. Proc Natl Acad Sci U S A. .

Abstract

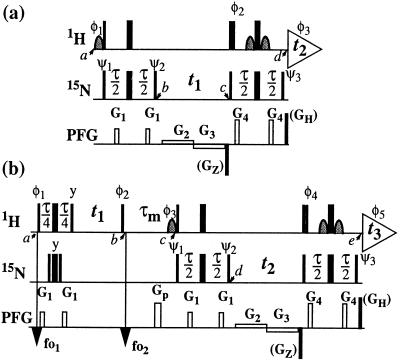
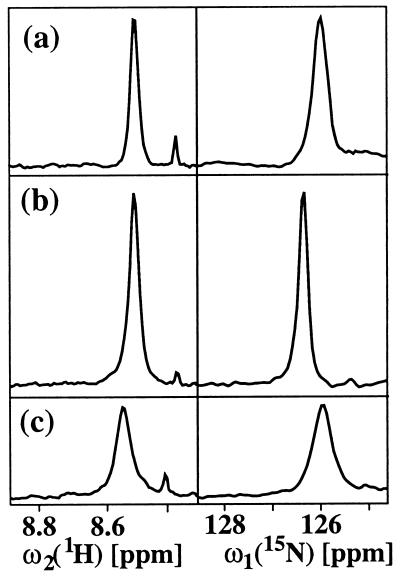
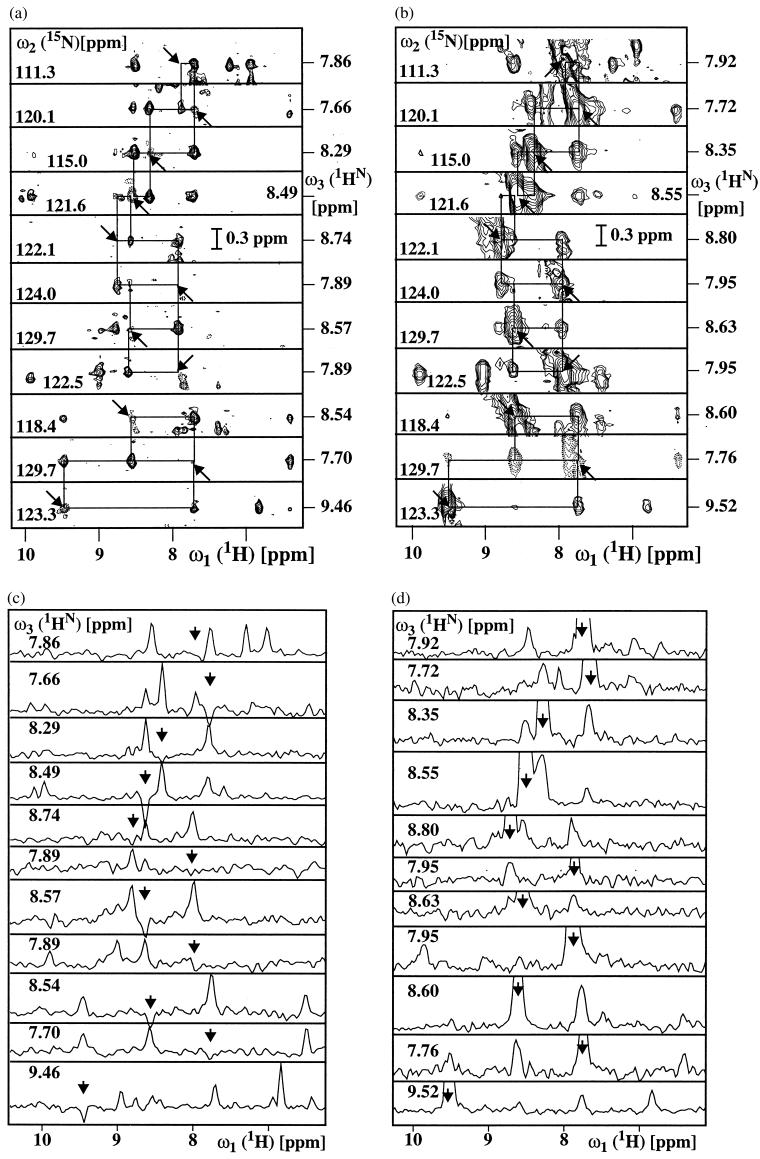
In our 3D NOESY-[(1)H,(15)N,(1)H]-ZQ-TROSY experiment, the TROSY principle (transverse relaxation-optimized spectroscopy) is used in three-dimensional (3D) (15)N-resolved nuclear Overhauser enhancement spectroscopy (NOESY), which enables resonance assignments by sequential nuclear Overhauser effects and the collection of structural constraints in large (15)N- or (2)H,(15)N-labeled proteins. Our experiment affords optimization of the transverse relaxation in all three frequency dimensions, provides suppression of the strong diagonal autorelaxation peaks, which otherwise tend to interfere with the analysis of nearby informative crosspeaks, and yields improved resolution for the entire spectrum when compared with conventional 3D (15)N-resolved-[(1)H,(1)H]-NOESY, because of the narrower lineshapes along both proton dimensions. The key element of this experiment is an approach for correlating the (15)N and (1)H chemical shifts with two-dimensional ZQ-[(15)N,(1)H]-TROSY, where zero-quantum (ZQ) coherence is generated and the remote cross-correlation between the (1)H and (15)N chemical shift anisotropy interactions is used to reduce transverse relaxation during (15)N evolution. Practical applications are illustrated with spectra of a protein with a molecular mass of 110,000 Da.


Figures

Figure 1
Figure 1
Schemes for the experiments discussed in this paper. (a) 2D ZQ-[15N,1H]-TROSY. (b) 3D NOESY-ZQ-[1H,15N,1H]-TROSY with transverse relaxation optimization in all three dimensions and suppression of the diagonal peaks. On the lines marked 1H and 15N, narrow and wide bars stand for nonselective 90° and 180° rf pulses, respectively, and curved shapes represent water-selective 90° rf pulses. Water saturation is minimized by returning the water magnetization to the +z axis before data acquisition (15, 18). The time period τ is set to 5.4 ms. The line marked PFG indicates pulsed magnetic field gradients applied along the z axis. (a) The gradients are: G1 amplitude 30 G/cm, duration 1 ms; G2, 5 G/cm, 0.5⋅t1; G3, −5 G/cm, 0.5⋅t1; G4, 40 G/cm, 1 ms. The phases for the rf pulses are: φ1 = {−x}; φ2 = {x}; φ3 = {x, −x, −y, y}; ψ1 = {−x, x, −y, y}; ψ2 = {y, −y, x, −x}; ψ3 = {y}; x on all other pulses. To obtain a complex interferogram, a second free induction decay (FID) is recorded for each t1 delay, with the following different phases: φ1 = {x}, φ2 = {−x}, φ3 = {x, −x, y, −y}, ψ3 = {−y}. After Fourier transformation in the ω2 dimension, the complex interferogram is multiplied by exp[−iΩHt1], where ΩH is the offset in the ω2 dimension relative to the 1H carrier frequency in rad s−1. Further data processing following ref. . (b) The gradients are: G1, 30 G/cm, 1 ms; Gp, 40 G/cm, 2 ms; G2, 5 G/cm, 0.5⋅t2; G3, −5 G/cm, 0.5⋅t2; G4, 40 G/cm, 1 ms. The phases of the rf pulses are: φ1 = {4(45°), 4(225°)}; φ2 = {x}; φ3 = {−x}; φ4 = {x}; φ5 = {x, −x, −y, y, −x, x, y, −y}; ψ1 = {−x, x, −y, y}; ψ2 = {y, −y, x, −x}; ψ3 = {y}; x on all other pulses. The 1H carrier frequency offsets are set to 8.7 ppm at time point fo1 and to 4.8 ppm at fo2. Quadrature detection in ω1 is achieved by the States time-proportional phase incrementation method (9) applied with the phase φ2. For each t2 increment, a second FID is recorded with the following different phases: φ3 = {x}, φ4 = {−x}, φ5 = {x, −x, y, −y, −x, x, −y, y}, ψ3 = {−y}. Further data processing as described for a. As an alternative, in both schemes the coherence selection can be supported by addition of the PFGs GZ (−50 G/cm, 1.59 ms) and GH (50 G/cm, 0.177 ms). GZ is then inverted in concert with the phase shifts used to obtain a complex interferogram, and the nonzero initial values for the evolution times need to be taken into account.
Figure 2
Figure 2
Comparison of three [15N,1H]-correlation experiments. (a) 2D ZQ-[15N,1H]-TROSY recorded with the scheme of Fig. 1a. (b) 2D single-quantum-[15N,1H]-TROSY recorded according to ref. . (c) Water-flip-back version of the conventional [15N,1H]-HSQC experiment (9). The experiments were performed at a 1H frequency of 750 MHz with a solution of [70% 2H,u15N] DHNA from S. aureus (20) in 95% 1H2O/5% 2H2O at 25°C and pH = 6.0. DHNA is a homooctamer protein of molecular mass 110,000; the concentration in the NMR sample was 0.4 mM as calculated per subunit. The measuring time and the experimental setup were identical for all three spectra. For a well-separated cross peak, cross sections along the 1H and 15N dimensions are shown.
Figure 3
Figure 3
Comparison of corresponding spectral regions in a 3D NOESY-ZQ-[1H,15N,1H]-TROSY spectrum recorded with the scheme of Fig. 1b (a, c) and a conventional 3D 15N-resolved [1H,1H]-NOESY spectrum recorded according to ref. (b, d). Both experiments were recorded with the sample of DHNA described in Fig. 2, using a Bruker DRX-750 spectrometer. Data size 128(t1)*30(t2)*1024(t3) complex points, t1max = 24 ms, t2max = 15 ms and t3max = 105 ms. Eight scans per increment were acquired, resulting in a measuring time of 34 h per spectrum. The spectra were processed with the program prosa (22). (a and b): Contour plots of [ω1(1H),ω3(1H)] strips. NOE connectivities are shown with thin horizontal and vertical lines. (c and d): Cross-sections taken along ω1(1H) at the ω3(1H) positions of the diagonal peaks in the strips a and b, respectively. In a–d, the positions of the diagonal peaks are indicated by arrows.

References

    1. Pervushin K, Riek R, Wider G, Wüthrich K. Proc Natl Acad Sci USA. 1997;94:12366–12371. - PMC - PubMed
    1. Pervushin K V, Wider G, Wüthrich K. J Biomol NMR. 1998;12:345–348. - PubMed
    1. Wüthrich K. Nat Struct Biol. 1998;5:492–495. - PubMed
    1. Pervushin K, Riek R, Wider G, Wüthrich K. J Am Chem Soc. 1998;120:6394–6400.
    1. Salzmann M, Pervushin K, Wider G, Senn H, Wüthrich K. Proc Natl Acad Sci USA. 1998;95:13585–13590. - PMC - PubMed

Publication types

LinkOut - more resources