. 1999 Aug 17;96(17):9695-700.
doi: 10.1073/pnas.96.17.9695.

The mouse bagpipe gene controls development of axial skeleton, skull, and spleen

Affiliations

The mouse bagpipe gene controls development of axial skeleton, skull, and spleen

L A Lettice et al. Proc Natl Acad Sci U S A. .

Abstract

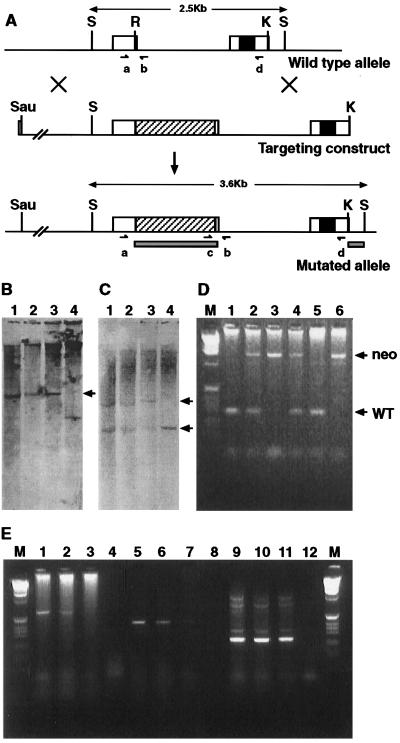
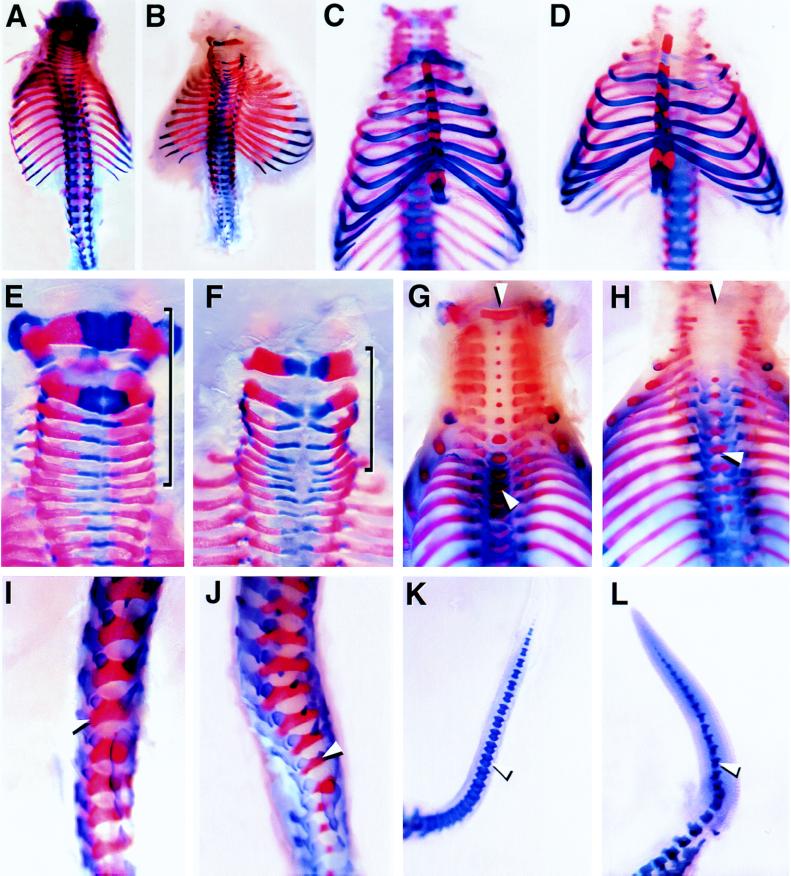
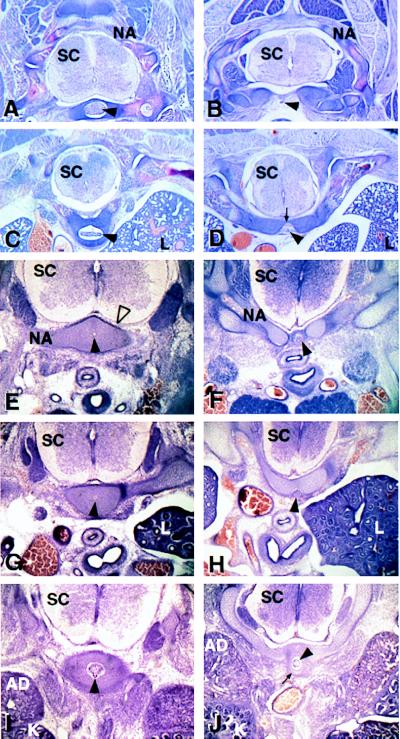
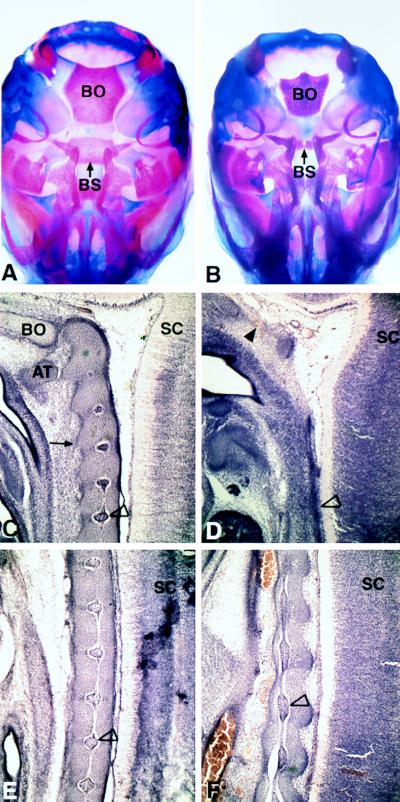
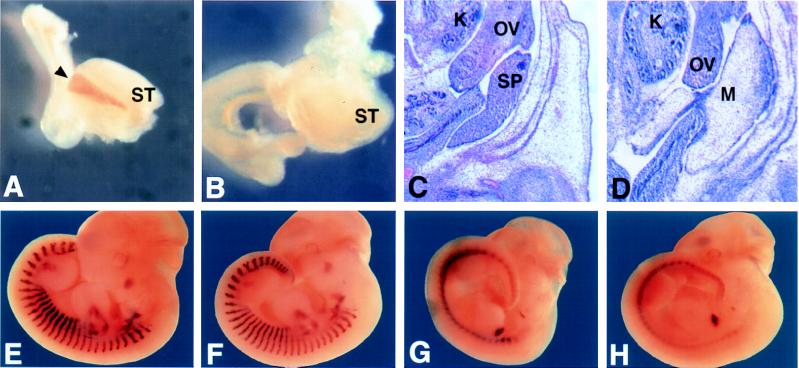
The mouse Bapx1 gene is homologous to the Drosophila homeobox containing bagpipe (bap) gene. A shared characteristic of the genes in these two organisms is expression in gut mesoderm. In Drosophila, bap functions to specify the formation of the musculature of the midgut. To determine the function of the mammalian cognate, we targeted a mutation into the Bapx1 locus. Bapx1, similar to Drosophila, does have a conspicuous role in gut mesoderm; however, this appears to be restricted to development of the spleen. In addition, Bapx1 has a major role in the development of the axial skeleton. Loss of Bapx1 affects the distribution of sclerotomal cells, markedly reducing the number that appear ventromedially around the notochord. Subsequently, the structures in the midaxial region, the intervertebral discs, and centra of the vertebral bodies, fail to form. Abnormalities are also found in those bones of the basal skull (basioccipital and basisphenoid bones) associated with the notochord. We postulate that Bapx1 confers the capacity of cells to interact with the notochord, effecting inductive interactions essential for development of the vertebral column and chondrocranium.


Figures

Figure 1
Figure 1
Diagrammatic representation of the genomic organization and analysis of the targeted mutation. (A) Top line shows the Bapx1 genomic organization, the open boxes representing the two exons, the filled-in box the homeobox. The middle line is the targeting construct, an approximate 7-kb fragment. The diagonally hatched bar shows the location of pMC1neo-polyA at the RsrII site. The bottom line represents the genomic organization after correct targeting. The solid bars show the position of the two probes used for Southern blot analysis, and the oligonucleotides used for genotyping are represented by a, b, c, and d. Abbreviations for restrictions sites are: S, SacI; R, RsrII; and K, KpnI. (B and C) Southern analysis of four ES cell clones after digestion with SacI. B was probed with the pMC1neo-polyA probe, and lanes 1, 2, and 3 show the expected 3.6-kb band (arrow) for the correctly targeted allele, and 4 shows the incorrectly targeted control. C was probed with the 3′ probe, external to the targeting construct (the right hand solid box in A). All four lanes show the wild-type 2.5-kb band (bottom arrow), whereas only lanes 1, 2, and 3 show the additional 3.6-kb band generated from the mutated allele (top arrow). D shows the results of PCR genotyping on the yolk sacs from a number of F2 progeny from a heterozygous intercross. The primers used are marked as a and b in Fig. 1A. These give rise to a 280-bp fragment from the wild-type allele (arrow marked WT) and 1.4 kb from the mutated allele (arrow marked neo). Thus the genotypes of the embryos are: lane1 +/+; lane 2 +/−; lane 3 −/−; lane 4 +/−; lane 5 +/+, lane 6 −/−. Analysis of expression from the mutant allele is shown in E. Embryonic RNA samples used were wild type in lanes 1, 5, and 9; Bapx1+/− in lanes 2, 6, and 10, and Bapx1−/− in lanes 3, 7, and 11. The no-RNA controls are in lanes 4, 8, and 12. Lanes 1–4 are reverse transcription–PCR products from 5′ of the neo insertion (primer a) to 3′ of the homeobox (primer d) and show no full-length transcripts in the Bapx1−/− track (lane 3). Lanes 5–8 use primers 3′ of the neo insertion to 3′ of the homeobox (primer d) and show reduced levels of transcription in the Bapx1−/− track (lane7). Lanes 9–12 show the product from the hypoxanthine phosphoribosyltransferase control primers.
Figure 2
Figure 2
Skeletal preparations of E18.5 fetuses. Wild-type (A, C, E, G, I, and K) and Bapx1−/− mutant (B, D, F, H, J, and L) fetuses were prepared such that the axial skeleton could be examined. In a dorsal view, the mutant fetus B has a slightly shortened skeleton, more highly compact vertebrae, and lateral extension of the ribs as compared with wild type (A). C and D are viewed ventrally, which shows that the ribs and sternum are unaffected in the mutant (D). Wild-type (E and G) and mutant (F and H) cervical vertebrae are shown dorsally (E and F) and ventrally (G and H). In E and F, the cervical vertebrae are highlighted by the bracket showing the compression of the mutant vertebrae (F). In G and H, the midline is indicated by the upper white arrowhead showing the medial ossification centers (red button of stain). The midline clefting seen in the mutant thoracic vertebrae is shown by the lower white arrowhead. A lateral view of the lumbar (I and J) region shows that the elements that form the neural arches are more narrow in the mutant (J). The arrowhead points to the last lumbar vertebra for comparison. The fetal tails are shown in K and L. The mutant tail (L) is shorter and thicker, and the vertebrae are missing the anterior processes (arrowhead).
Figure 3
Figure 3
Histological analysis of wild-type and mutant embryos. Transverse sections are shown for E18.5 (A–D) and E14.5 (E–J) wild-type (A, C, E, G, and I) and Bapx1−/− (B, D, F, H, and J) embryos. A, B, E, and F are sections at the level of the cervical vertebrae, C, D, G, and H, the thoracic vertebrae, and I and J, the lumbar vertebrae. At E18.5, the notochord has given rise to the nucleus pulposum (arrowhead in A and C) surrounded by the vertebral body. In the mutant (B and D), these elements are missing, and the arrowheads indicate the vestigial notochord. Note the ventral bridges of the neural arches (arrow in D). At E14.5, cells in the wild type have organized at the ventral midline around the notochord (black arrowhead) at all axial levels (E, G, and I). In the mutant, few cells organize around the notochord in the cervical and thoracic vertebrae (F and H). In the lumbar region (J), more cells are apparent (arrow), but are not well organized. SC, spinal cord; NA, neural arch; L, lung; Ad, Adrenal; and K, Kidney.
Figure 4
Figure 4
Analysis of the chondrocranium (A and B at E18.5) and notochord (C–F at E14.5) Ventral views of the skull of wild type (A) and mutant (B) show a decrease in size of the basioccipital bone (BO) and posterior basisphenoid bone (BS). C–F show sagittal sections of wild-type (C and E) and mutant (D and F) embryos near the midline of the axial skeleton through the notochord region. C and D are sections from the cervical region. The characteristic notochordal swellings are shown in C (open arrowhead indicates characteristic swelling). The thin mutant notochord is indicated by the open arrowhead in D. The condensing cells of the anterior located basioccipital bone (in C, designated BO) are missing in the mutant (region indicted by filled arrowhead in D). More posteriorly, the periodic notochordal swellings in wild type (open arrowhead in E) are abnormal in the mutant (F). AT, anterior arch of the atlas; SC, spinal cord; BO, basioccipital; BS, posterior basisphenoid.
Figure 5
Figure 5
Analysis of the spleen and expression of Hox11, myogenin, and Pax1. Expression of Hox11 at E12 was examined in stomach and surrounding tissue from dissected embryos. The spleen of wild-type (A) embryos is observed as a brown stripe next to the stomach (black arrowhead), which is missing in Bapx1−/− (B). Histological examination in transverse sections shows densely packed cells of the spleen in wild type (in C, designated SP), which is not observed in a comparable region of mesentery in the mutant (D). Wild type (E and F) and mutant (G and H) show no differences in the expression of myogenin (lateral stripes in E and F) or Pax1 (lateral periodic spots in G and H). ST, stomach; K, kidney; OV, ovary; SP, spleen; M, mesentary.

Similar articles

Cited by

References

    1. Tribioli C, Frasch M, Lufkin T. Mech Dev. 1997;65:145–162. - PubMed
    1. Tribioli C, Lufkin T. Gene. 1997;203:225–233. - PubMed
    1. Kim Y, Nirenberg M. Proc Natl Acad Sci USA. 1989;86:7716–7720. - PMC - PubMed
    1. Harvey R P. Dev Biol. 1996;178:203–216. - PubMed
    1. Newman C S, Grow M W, Cleaver O, Chia F, Krieg P. Dev Biol. 1997;181:223–233. - PubMed