

doi: 10.1073/pnas.96.17.9701.
Phenological changes reflect climate change in Wisconsin
Affiliations
- PMID: 10449757
- PMCID: PMC22273
- DOI: 10.1073/pnas.96.17.9701
Item in Clipboard
Phenological changes reflect climate change in Wisconsin
Proc Natl Acad Sci U S A.
.
Abstract
A phenological study of springtime events was made over a 61-year period at one site in southern Wisconsin. The records over this long period show that several phenological events have been increasing in earliness; we discuss evidence indicating that these changes reflect climate change. The mean of regressions for the 55 phenophases studied was -0.12 day per year, an overall increase in phenological earliness at this site during the period. Some phenophases have not increased in earliness, as would be expected for phenophases that are regulated by photoperiod or by a physiological signal other than local temperature.
Figures
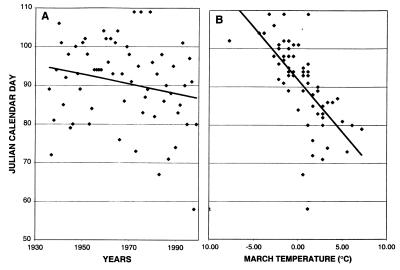
Regression analysis of the date of ice-melt from
Lake Mendota over the years of phenological records. (A) The
Julian calendar day of ice-melt is plotted against the year. The
regression indicates a change in earliness of −0.124 day per year
(R2 = 0.046). (B) the Julian
calendar day of ice-melt is plotted against the average temperature for
the month of march. The regression in this case indicates a change in
earliness of −2.719 days per degree of March temperature
(R2 = 0.453). Data on ice break-up are
from State Climatology Office, 1999: Lake Mendota Ice Summary,
1853–1999, Electronic database appearing at
http://www.uwex.edu/sco/icemend.html , Wisconsin Geological and Natural
History Survey, Madison. Data for Madison temperatures are from
National Climatic Data Center, Local Climatological Data for Madison,
WI, at the Environmental Data and Information Service, National Oceanic
and Atmospheric Administration, Asheville, NC.
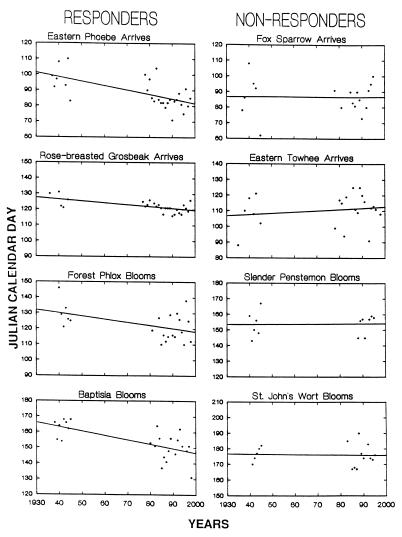
On the left are regressions of four selected
springtime phenophases that do show significant increases in earliness
during the 61-year period of record: arrival dates of migrating eastern
phoebe (Sayornis phoebe) and rose-breasted grosbeak
(Pheucticus ludovicianus) and first-bloom date of forest
phlox (Phlox divaricata) and baptisia (Baptisia
leucantha). These are compared with four selected phenophases
that do not show significant increases in earliness: arrival dates of
fox sparrow (Passarella iliaca) and eastern towhee
(Pipilio erythrophthalamus) and first-bloom dates of
slender pentstemon (Pentstemon gracilis) and St. John’s
wort (Hypericum perforatum). The regression values are
recorded in Table 1.
References
-
- Leith H, editor. Phenology and Seasonality Modeling. New York: Springer; 1976. p. 369. , 401.
-
- Suzuki S, Kudo G. Global Change Biol. 1997;3:108–115.
-
- Oettingen A J. Phanologie der Dorpater Lignosum. Dorpot, Estonia: Heinrich Laakmann; 1879.
-
- Waggoner P E. In: Phenology and Seasonality Modeling. Leith M, editor. New York: Springer; 1974. pp. 401–405.
-
- Beaubien E G, Johnson D L. Int J Biometeorol. 1994;38:23–28.
LinkOut - more resources
Full Text Sources
