

Noninvasive quantitation of cytosine deaminase transgene expression in human tumor xenografts with in vivo magnetic resonance spectroscopy
- PMID: 10449778
- PMCID: PMC22294
- DOI: 10.1073/pnas.96.17.9821
Noninvasive quantitation of cytosine deaminase transgene expression in human tumor xenografts with in vivo magnetic resonance spectroscopy
Abstract
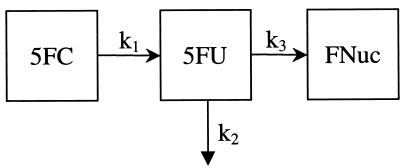
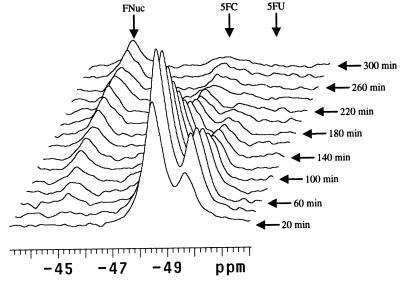
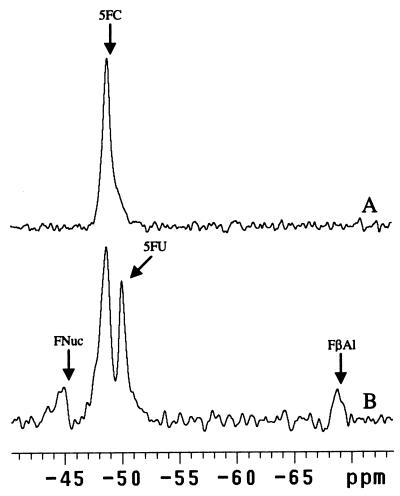
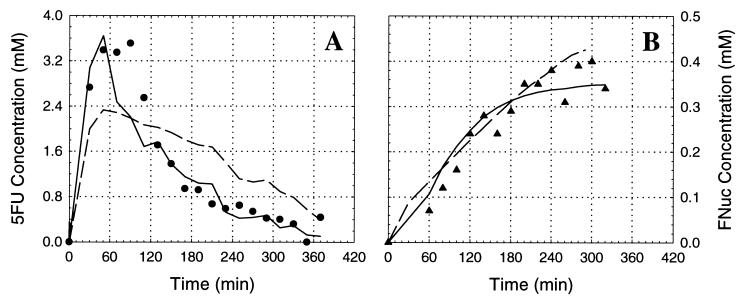
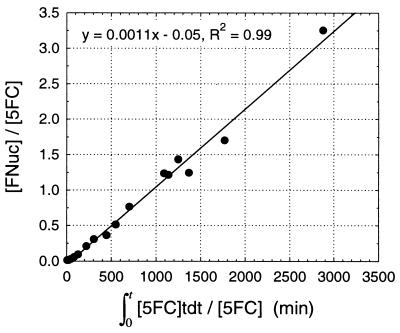
Analysis of transgene expression in vivo currently requires destructive and invasive molecular assays of tissue specimens. Noninvasive methodology for assessing the location, magnitude, and duration of transgene expression in vivo will facilitate subject-by-subject correlation of therapeutic outcomes with transgene expression and will be useful in vector development. Cytosine deaminase (CD) is a microbial gene undergoing clinical trials in gene-directed enzyme prodrug gene therapy. We hypothesized that in vivo magnetic resonance spectroscopy could be used to measure CD transgene expression in genetically modified tumors by directly observing the CD-catalyzed conversion of the 5-fluorocytosine (5-FC) prodrug to the chemotherapeutic agent 5-fluorouracil (5-FU). The feasibility of this approach is demonstrated in subcutaneous human colorectal carcinoma xenografts in nude mice by using yeast CD (yCD). A three-compartment model was used to analyze the metabolic fluxes of 5-FC and its metabolites. The rate constants for yCD-catalyzed prodrug conversion (k(1)(app)), 5-FU efflux from the observable tumor volume (k(2)(app)), and formation of cytotoxic fluorinated nucleotides from 5-FU (k(3)(app)) were 0.49 +/- 0.27 min(-1), 0.766 +/- 0.006 min(-1), and 0.0023 +/- 0.0007 min(-1), respectively. The best fits of the 5-FU concentration data assumed first-order kinetics, suggesting that yCD was not saturated in vivo in the presence of measured intratumoral 5-FC concentrations well above the in vitro K(m). These results demonstrate the feasibility of using magnetic resonance spectroscopy to noninvasively monitor therapeutic transgene expression in tumors. This capability provides an approach for measuring gene expression that will be useful in clinical gene therapy trials.
Figures
Similar articles
-
Yeast cytosine deaminase improves radiosensitization and bystander effect by 5-fluorocytosine of human colorectal cancer xenografts.Cancer Res. 2000 Dec 1;60(23):6649-55. Cancer Res. 2000. PMID: 11118048
-
Superiority of yeast over bacterial cytosine deaminase for enzyme/prodrug gene therapy in colon cancer xenografts.Cancer Res. 1999 Apr 1;59(7):1417-21. Cancer Res. 1999. PMID: 10197605
-
Cytosine deaminase adenoviral vector and 5-fluorocytosine selectively reduce breast cancer cells 1 million-fold when they contaminate hematopoietic cells: a potential purging method for autologous transplantation.Blood. 1998 Jul 15;92(2):672-82. Blood. 1998. PMID: 9657770
-
Enzyme/prodrug therapy for head and neck cancer using a catalytically superior cytosine deaminase.Hum Gene Ther. 1999 Aug 10;10(12):1993-2003. doi: 10.1089/10430349950017356. Hum Gene Ther. 1999. PMID: 10466633
-
Assessing gene expression in vivo: magnetic resonance imaging and spectroscopy.Gene Ther. 2000 Aug;7(15):1259-64. doi: 10.1038/sj.gt.3301218. Gene Ther. 2000. PMID: 10918496 Review.
Cited by
-
Magnetic resonance reporter gene imaging.Theranostics. 2012;2(4):403-12. doi: 10.7150/thno.3634. Epub 2012 Apr 12. Theranostics. 2012. PMID: 22539936 Free PMC article.
-
Noninvasive real-time imaging of apoptosis.Proc Natl Acad Sci U S A. 2002 Dec 24;99(26):16551-5. doi: 10.1073/pnas.252644499. Epub 2002 Dec 10. Proc Natl Acad Sci U S A. 2002. PMID: 12475931 Free PMC article.
-
Monitoring enzyme activity using a diamagnetic chemical exchange saturation transfer magnetic resonance imaging contrast agent.J Am Chem Soc. 2011 Oct 19;133(41):16326-9. doi: 10.1021/ja204701x. Epub 2011 Sep 23. J Am Chem Soc. 2011. PMID: 21919523 Free PMC article.
-
Prodrugs for Gene-Directed Enzyme-Prodrug Therapy (Suicide Gene Therapy).J Biomed Biotechnol. 2003;2003(1):48-70. doi: 10.1155/S1110724303209098. J Biomed Biotechnol. 2003. PMID: 12686722 Free PMC article.
-
Cytoplasmically retargeted HSV1-tk/GFP reporter gene mutants for optimization of noninvasive molecular-genetic imaging.Neoplasia. 2003 May-Jun;5(3):245-54. doi: 10.1016/S1476-5586(03)80056-8. Neoplasia. 2003. PMID: 12869307 Free PMC article.
References
-
- Crystal R G, Hirschowitz E, Lieberman M, Daly J, Kazam E, Henschke C, Yankelevitz D, Kemeny N, Silverstein R, Ohwada A, et al. Hum Gene Ther. 1997;8:985–1001. - PubMed
-
- Calabresi P, Chabner B. In: Goodman and Gilman’s The Pharmacological Basis of Therapeutics. Hardman L, Limbird P, Molinoff P, Ruddon R, Gilman A, editors. New York: Pergamon; 1995. pp. 1225–1287.
-
- McSheehy P, Griffiths J. NMR Biomed. 1989;2:122–141. - PubMed
-
- Blackstock A W, Kwock L, Branch C, Zeman E M, Tepper J E. Int J Radiat Oncol Biol Phys. 1996;36:641–648. - PubMed
-
- McSheehy P M, Robinson S P, Ojugo A S, Aboagye E O, Cannell M B, Leach M O, Judson I R, Griffiths J R. Cancer Res. 1998;58:1185–1194. - PubMed
Publication types
MeSH terms
Substances
Grants and funding
LinkOut - more resources
Full Text Sources
Miscellaneous
