. 1999 Aug;134(1-2):16-28.
doi: 10.1016/s0378-5955(99)00061-1.

Distributed representation of spectral and temporal information in rat primary auditory cortex

Affiliations

Distributed representation of spectral and temporal information in rat primary auditory cortex

M P Kilgard et al. Hear Res. 1999 Aug.

Abstract

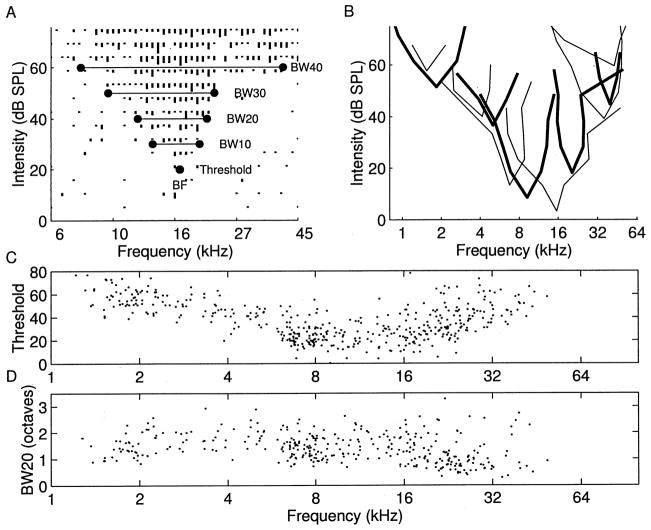
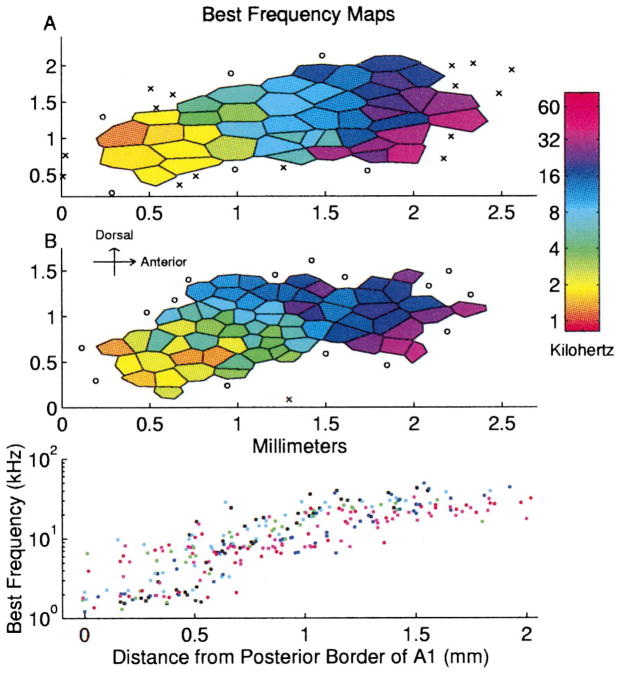
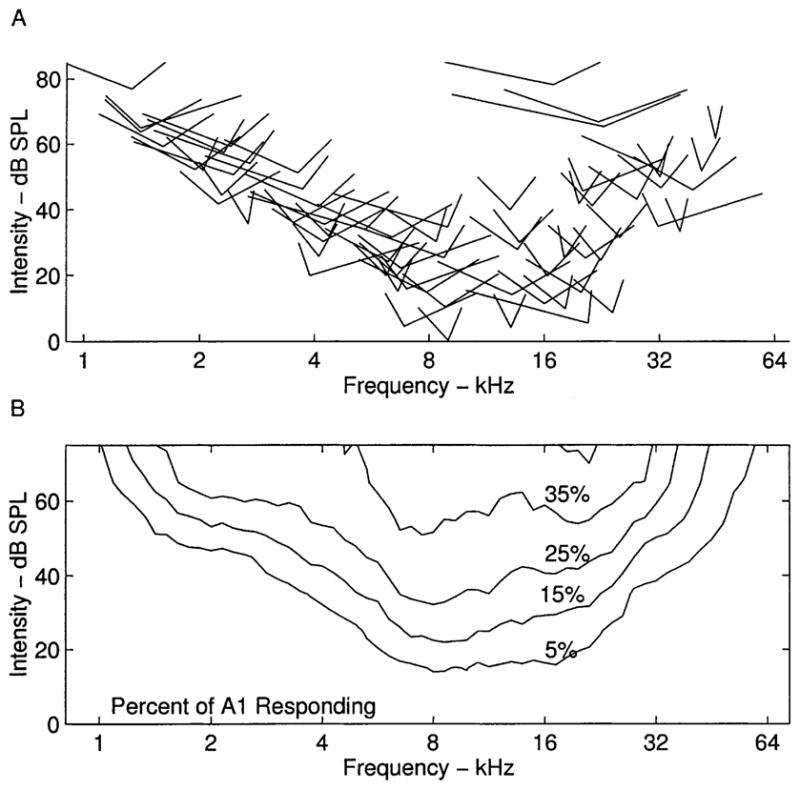
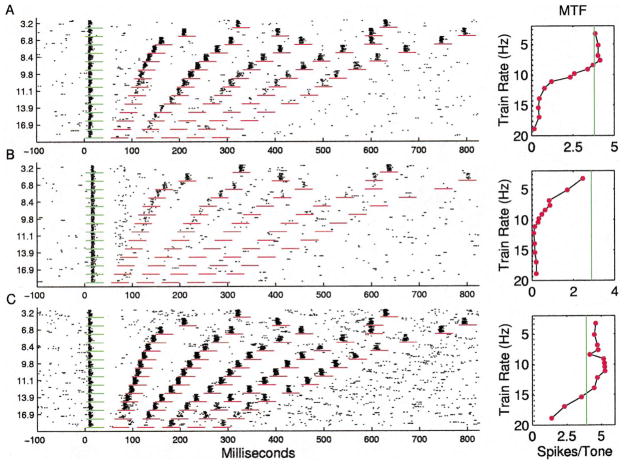
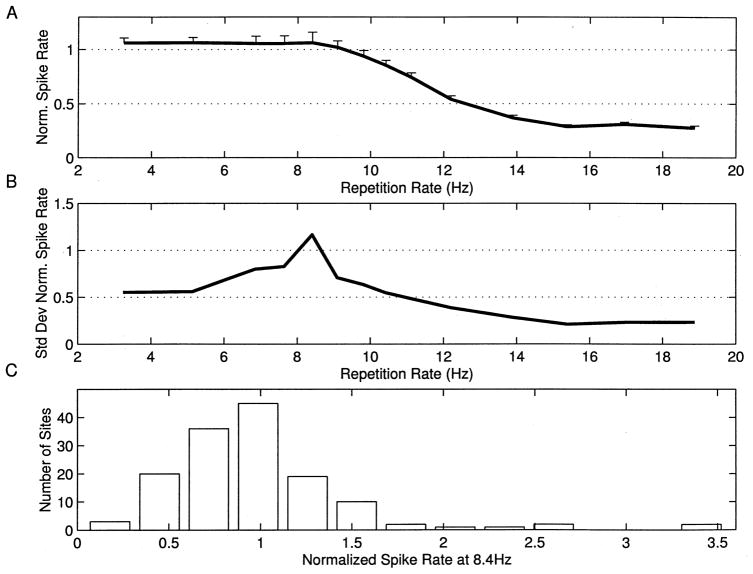
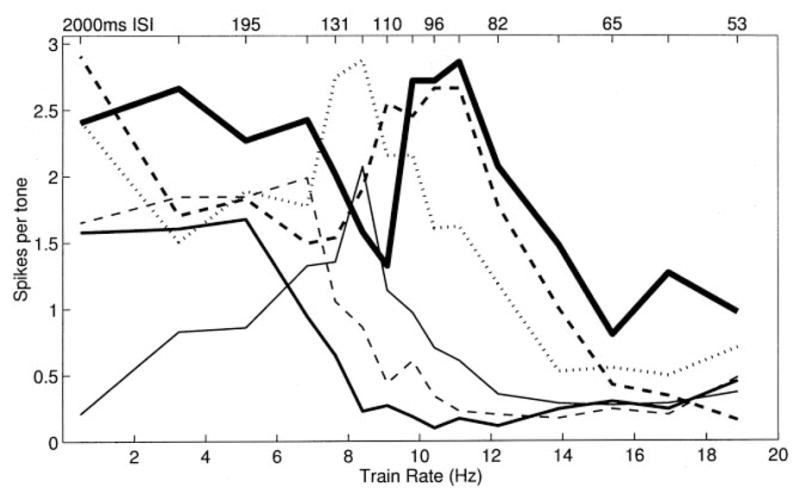
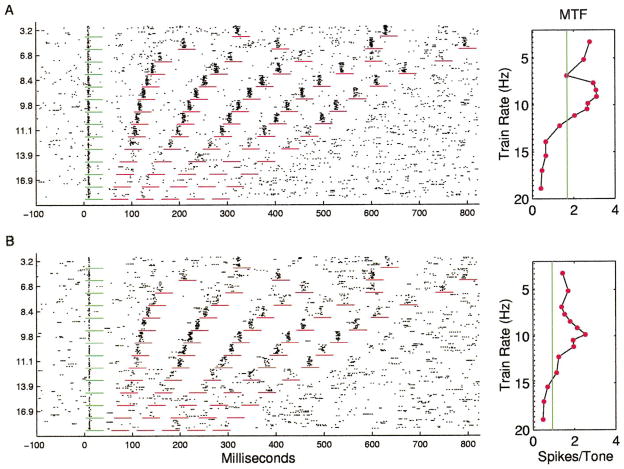
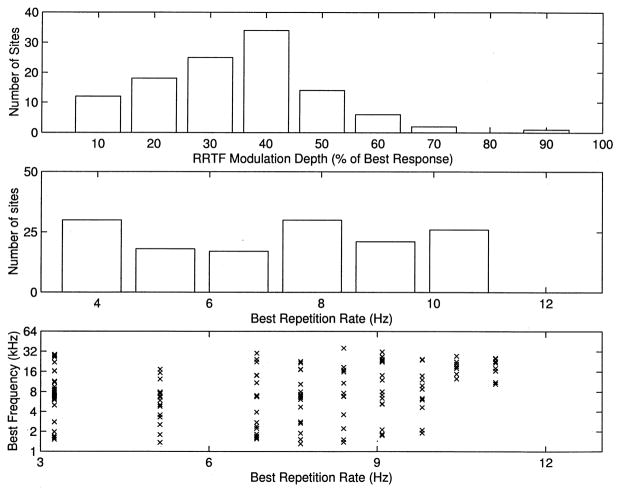
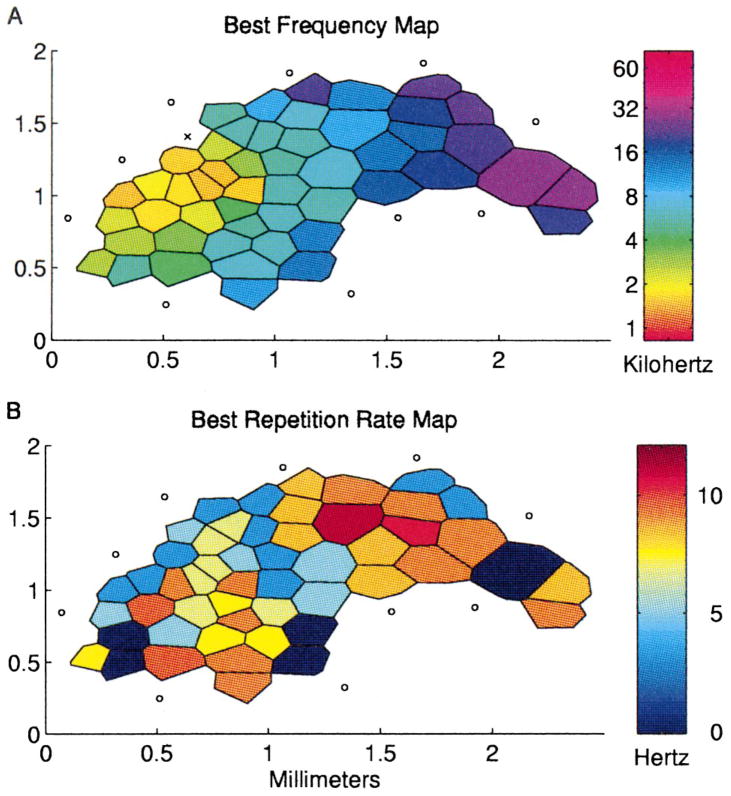
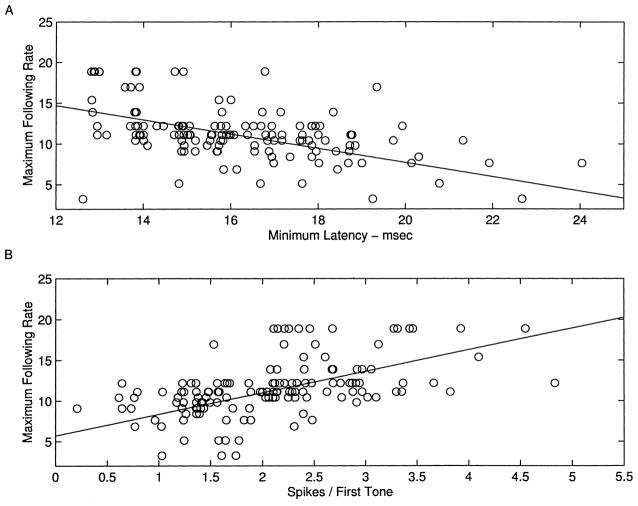
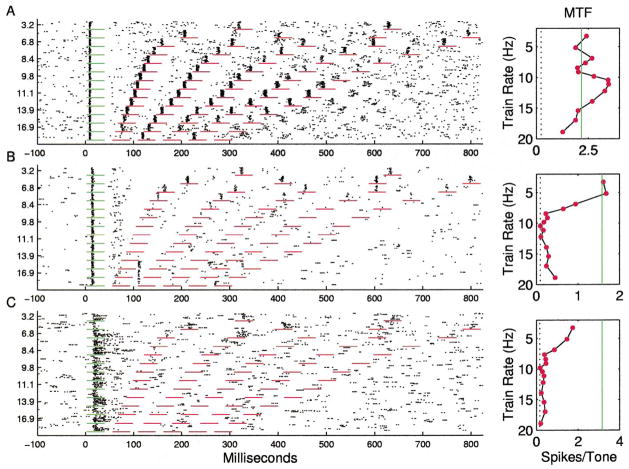
Modulations of amplitude and frequency are common features of natural sounds, and are prominent in behaviorally important communication sounds. The mammalian auditory cortex is known to contain representations of these important stimulus parameters. This study describes the distributed representations of tone frequency and modulation rate in the rat primary auditory cortex (A1). Detailed maps of auditory cortex responses to single tones and tone trains were constructed from recordings from 50-60 microelectrode penetrations introduced into each hemisphere. Recorded data demonstrated that the cortex uses a distributed coding strategy to represent both spectral and temporal information in the rat, as in other species. Just as spectral information is encoded in the firing patterns of neurons tuned to different frequencies, temporal information appears to be encoded using a set of filters covering a range of behaviorally important repetition rates. Although the average A1 repetition rate transfer function (RRTF) was low-pass with a sharp drop-off in evoked spikes per tone above 9 pulses per second (pps), individual RRTFs exhibited significant structure between 4 and 10 pps, including substantial facilitation or depression to tones presented at specific rates. No organized topography of these temporal filters could be determined.


Figures

Fig. 1
Fig. 1
A: Tuning curve for representative rat A1 penetration. BF is the frequency that elicits a consistent neural response at the lowest intensity, threshold. BW is the range of frequencies the neurons are responsive to at the specified intensity above threshold. B: Eleven tuning curve outlines from A1 in a single animal. C: Thresholds to elicit excitatory responses at BF, for neurons sampled from nine animals. D: Bandwidths at 20 dB above threshold as a function of BF.
Fig. 2
Fig. 2
A, B: Representative BF maps of primary rat auditory cortex from two adult rats. Each polygon represents one penetration. Color represents each site’s best frequency. Non-responsive and auditory responding non-A1 sites are marked ○ and ×, respectively. Bottom panel: Best frequency as a function of distance from the posterior border of A1. Each color represents data from an individual animal.
Fig. 3
Fig. 3
A: Tuning curve tips for all of the penetrations from one rat (Fig. 2B). The tip of each V depicts the minimum threshold for each site. Width of the V represents tuning curve width 10 dB above threshold. B: Mean percent of the cortical surface that responds to a tone of any frequency/intensity combination.
Fig. 4
Fig. 4
A: Dot raster and repetition rate transfer function for an A1 site representative of the median response. Short horizontal lines mark time windows used for RRTF quantification. Vertical solid lines in panels to the right mark the average response to first tone. Vertical dotted line marks spontaneous rate. B: A1 RRTF with an unusually low (7 pps) cutoff. C: A1 RRTF with unusually fast (high repetition rate) following.
Fig. 5
Fig. 5
A: Mean normalized spike rate as a function of repetition rate with standard errors of the mean. B: Standard deviation of normalized spike rate as a function of repetition rate. C: Distribution of normalized spike rates at 8.4 pps. Examples shown in Figs. 4 and 7 have ratios of 0.97, 0.22, 1.07, 1.83, and 1.9 at 8.4 pps, respectively.
Fig. 6
Fig. 6
RRTFs for six penetrations with strong tuning for specific repetition rates. Note that the sum of these RRTFs has a low-pass shape.
Fig. 7
Fig. 7
A: Example of a notched RRTF. B: Example of a band-pass RRTF.
Fig. 8
Fig. 8
A: Distribution of RRTF modulation depth, expressed as the minimum response for repetition rates less than the best rate divided by the response to the best rate. The examples in Figs. 4 and 7 have depths of 8, –, 26, 47 and 63%, respectively. Note that only sites with best repetition rates greater than 4 pps are shown. B: Distribution of best repetition rates (rate that evokes the most spikes per tone). C: Best repetition rate as a function of BF.
Fig. 9
Fig. 9
Representative map of A1 from one animal with the best tone frequency and best repetition rate labeled for each penetration. Reliable RRTFs could not be generated from sites labeled zero.
Fig. 10
Fig. 10
A, B: Scatter plots of maximum following rate as a function of minimum latency and spikes evoked per tone, with best linear fits.
Fig. 11
Fig. 11
A: An RRTF that exhibits oscillatory responses after trains of greater than 10 pps. B: Unusual A1 RRTF. Note the fixed-latency response following the second tone presented at greater than 14 pps. C: Representative RRTF for the posterior auditory field. Note sustained discharge and strong adaptation to repeated stimuli.

References

    1. Aitkin LM, Merzenich MM, Irvine DR, Clarey JC, Nelson JE. J Comp Neurol. 1986;252:175–185. - PubMed
    1. Arnault P, Roger M. J Comp Neurol. 1990;302:110–123. - PubMed
    1. Batzri-Izraeli R, Kelly JB, Glendenning KK, Masterton RB, Wollberg Z. Brain Behav Evol. 1990;36:237–248. - PubMed
    1. Brosch M, Schreiner CE. J Neurophysiol. 1997;77:923–943. - PubMed
    1. Buonomano DV, Merzenich MM. Science. 1995;267:1028–1030. - PubMed

Publication types

LinkOut - more resources