. 1999 Jul;127(5):1135-44.
doi: 10.1038/sj.bjp.0702657.

Pharmacological characterization of extracellular acidification rate responses in human D2(long), D3 and D4.4 receptors expressed in Chinese hamster ovary cells

Affiliations

Pharmacological characterization of extracellular acidification rate responses in human D2(long), D3 and D4.4 receptors expressed in Chinese hamster ovary cells

M C Coldwell et al. Br J Pharmacol. 1999 Jul.

Abstract

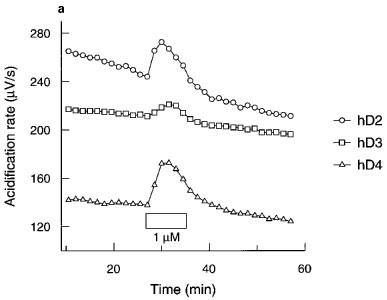
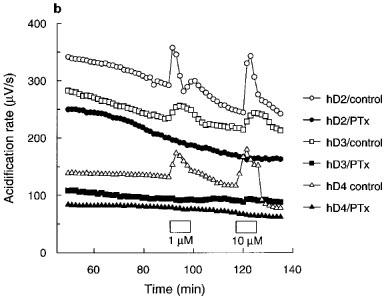
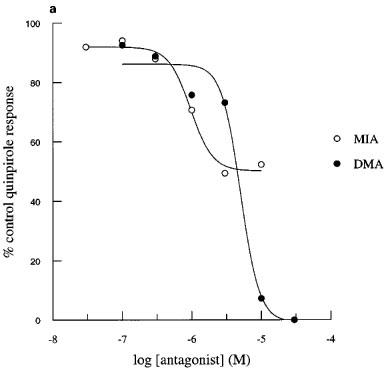
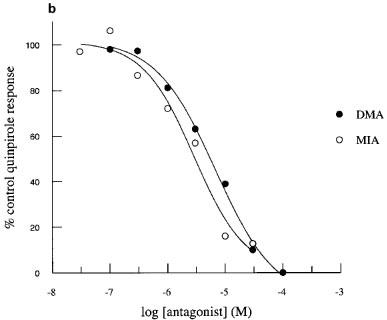
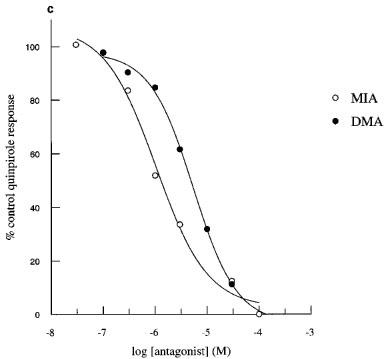
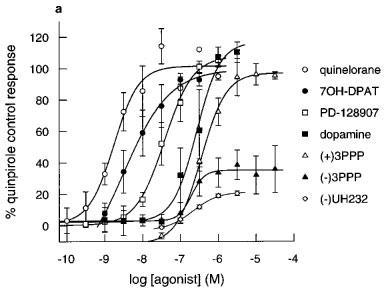
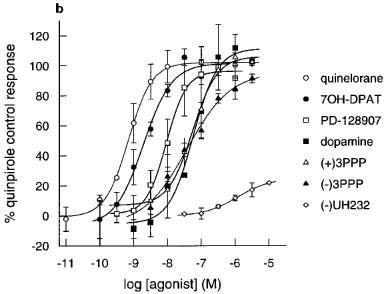
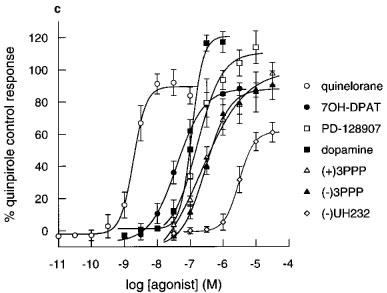
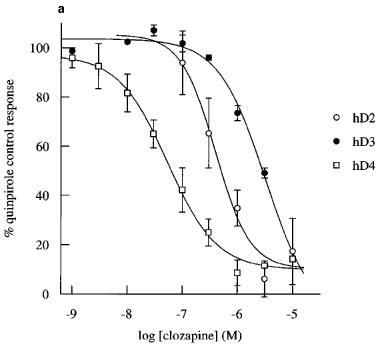
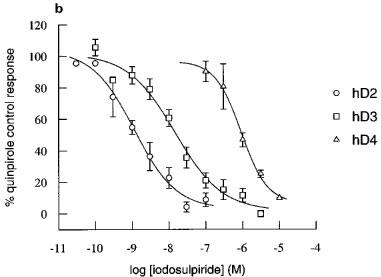
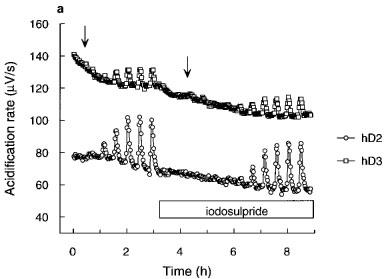
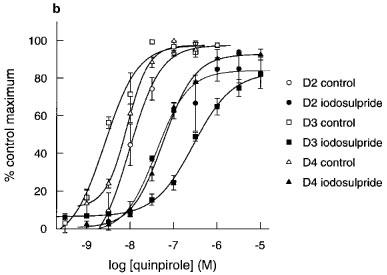
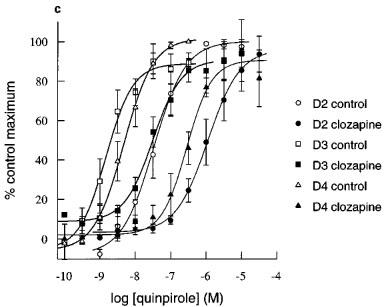
This study characterized pharmacologically the functional responses to agonists at human dopamine D2(long) (hD2), D3 (hD3) and D4.4 (hD4) receptors separately expressed in cloned cells using the cytosensor microphysiometer. Dopaminergic receptor agonists caused increases in extracellular acidification rate in adherent Chinese hamster ovary (CHO) clones expressing hD2, hD3 or hD4 receptors. Acidification rate responses to agonists in other cell lines expressing these receptors were smaller than those in adherent CHO cells. The time courses and maximum increases in acidification rate of the agonist responses in adherent CHO cells were different between the three dopamine receptor clones. Responses were blocked by pretreatment of cells with pertussis toxin or amiloride analogues. Most agonists had full intrinsic activity at each of the dopamine receptor subtypes, as compared to quinpirole, however both enantiomers of UH-232 and (-)3-PPP were partial agonists in this assay system. The functional potency of full agonists at each of the three receptors expressed in CHO cells was either higher than, or similar to, the apparent inhibition constants (Ki) determined in [125I]-iodosulpride competition binding studies. Functional selectivities of the agonists were less than radioligand binding selectivities. The rank orders of agonist potencies and selectivities were similar, but not identical, to the rank orders of radioligand binding affinities and selectivities. The dopamine receptor antagonists, iodosulpride and clozapine, had no effect on basal acidification rates but inhibited acidification responses in CHO cells to quinpirole in an apparently competitive manner. Antagonist potencies closely matched their radioligand binding affinities in these cells.


Figures

Figure 1
Figure 1
(a) Time course and (b) effect of pertussis toxin (PTx; 100 ng ml−1) on quinpirole acidification rate responses in CHO cells expressing hD2, hD3 or hD4 receptors. Data are from a single experiment representative of at least two tests. Exposure to quinpirole indicated by the boxes. Data for hD3 control cells in (b) offset by −40 μV s−1 for clarity.
Figure 1
Figure 1
(a) Time course and (b) effect of pertussis toxin (PTx; 100 ng ml−1) on quinpirole acidification rate responses in CHO cells expressing hD2, hD3 or hD4 receptors. Data are from a single experiment representative of at least two tests. Exposure to quinpirole indicated by the boxes. Data for hD3 control cells in (b) offset by −40 μV s−1 for clarity.
Figure 2
Figure 2
Inhibition of quinpirole-induced increases in acidification rate by MIA or DMA in CHO cells expressing hD2, hD3 or hD4 receptors. Data are expressed as a percentage of the average response to three control exposures to a single concentration of quinpirole 100 nM in hD2 cells (a), 30 nM in hD3 cells (b) and 100 nM in D4 cells (c) and shown as the mean value obtained in 3–4 experiments. Error bars omitted for clarity.
Figure 2
Figure 2
Inhibition of quinpirole-induced increases in acidification rate by MIA or DMA in CHO cells expressing hD2, hD3 or hD4 receptors. Data are expressed as a percentage of the average response to three control exposures to a single concentration of quinpirole 100 nM in hD2 cells (a), 30 nM in hD3 cells (b) and 100 nM in D4 cells (c) and shown as the mean value obtained in 3–4 experiments. Error bars omitted for clarity.
Figure 3
Figure 3
Effect of agonists on extracellular acidification rates in CHO cells expressing (a) hD2 receptors (b) hD3 receptors and (c) hD4 receptors determined on the Cytosensor microphysiometer. Results are mean±s.e.mean from 3–7 experiments. Data expressed as a percentage of the quinpirole control response (100 nM in hD3 or 1000 nM in hD2 and hD4 cells) in each chamber. Data for quinpirole, apomorphine and (+)-UH232 omitted for clarity, results are in Table 2.
Figure 3
Figure 3
Effect of agonists on extracellular acidification rates in CHO cells expressing (a) hD2 receptors (b) hD3 receptors and (c) hD4 receptors determined on the Cytosensor microphysiometer. Results are mean±s.e.mean from 3–7 experiments. Data expressed as a percentage of the quinpirole control response (100 nM in hD3 or 1000 nM in hD2 and hD4 cells) in each chamber. Data for quinpirole, apomorphine and (+)-UH232 omitted for clarity, results are in Table 2.
Figure 4
Figure 4
Inhibition by clozapine and iodosulpride of quinpirole-induced increases in acidification rate in CHO cells expressing hD2, hD3 or hD4 receptors. Concentration-inhibition curves for (a) clozapine (b) and iodosulpride. Results in (a) and (b) are the mean±s.e.mean of 3–16 experiments. Stimulation was by 30 nM quinpirole in hD3 cells or 100 nM quinpirole in hD2 and hD4 cells.
Figure 4
Figure 4
Inhibition by clozapine and iodosulpride of quinpirole-induced increases in acidification rate in CHO cells expressing hD2, hD3 or hD4 receptors. Concentration-inhibition curves for (a) clozapine (b) and iodosulpride. Results in (a) and (b) are the mean±s.e.mean of 3–16 experiments. Stimulation was by 30 nM quinpirole in hD3 cells or 100 nM quinpirole in hD2 and hD4 cells.
Figure 5
Figure 5
Apparent pA2 determinations for iodosulpride and clozapine in hD2, hD3 or hD4 receptor clones. (a) Representative acidification rate trace showing the effect of iodosulpride (3 nM for the hD2 cells and 300 nM for the hD3 cells) on quinpirole-induced increases in acidification rate. The start of each quinpirole concentration-response curve is indicated by the arrows. hD4 trace omitted for clarity. Rightward shifts (closed symbols) of agonist responses (open symbols) by (b) iodosulpride (3, 300 and 3000 nM for hD2, hD3 and hD4 clones respectively) and (c) clozapine (3000 nM for all clones).
Figure 5
Figure 5
Apparent pA2 determinations for iodosulpride and clozapine in hD2, hD3 or hD4 receptor clones. (a) Representative acidification rate trace showing the effect of iodosulpride (3 nM for the hD2 cells and 300 nM for the hD3 cells) on quinpirole-induced increases in acidification rate. The start of each quinpirole concentration-response curve is indicated by the arrows. hD4 trace omitted for clarity. Rightward shifts (closed symbols) of agonist responses (open symbols) by (b) iodosulpride (3, 300 and 3000 nM for hD2, hD3 and hD4 clones respectively) and (c) clozapine (3000 nM for all clones).

Similar articles

Cited by

References

    1. ASGHARI V., SANYAL S., BUCHWALDT S., PATERSON A., JOVANOVIC V., VAN TOL H. Modulation of intracellular cyclic AMP levels by different human dopamine D4 receptor variants. J. Neurochem. 1995;65:1157–1165. - PubMed
    1. BOWEN W.P., COLDWELL M.C., HICKS F.R., RILEY G.J. Further characterisation of human D2 and D3 receptors-GppNHp shifts are explained by the presence of more than one binding site in each clone. Br. J. Pharmacol. 1993;108:277P.
    1. BOWEN W.P., JERMAN J.C. Nonlinear regression using spreadsheets. Trends Pharmacol. Sci. 1995;16:413–417. - PubMed
    1. BOYFIELD I., WINN F., COLDWELL M.C. Comparison of agonist potencies at human D2 and D3 receptors, expressed in the same cell line, using the Cytosensor microphysiometer. Biochem. Soc. Trans. 1996;24:57S. - PubMed
    1. BURRIS K.D., PACHECO M.A., FILTZ T.M., KUNG M.-P., KUNG H.F., MOLINOFF P.B. Lack of discrimination by agonists for D2 and D3 dopamine receptors. Neuropsychopharmacology. 1995;12:335–345. - PubMed

LinkOut - more resources