

Analysis of the atypical characteristics of adenosine receptors mediating negative inotropic and chronotropic responses of guinea-pig isolated atria and papillary muscles
- PMID: 10455318
- PMCID: PMC1566162
- DOI: 10.1038/sj.bjp.0702719
Analysis of the atypical characteristics of adenosine receptors mediating negative inotropic and chronotropic responses of guinea-pig isolated atria and papillary muscles
Abstract
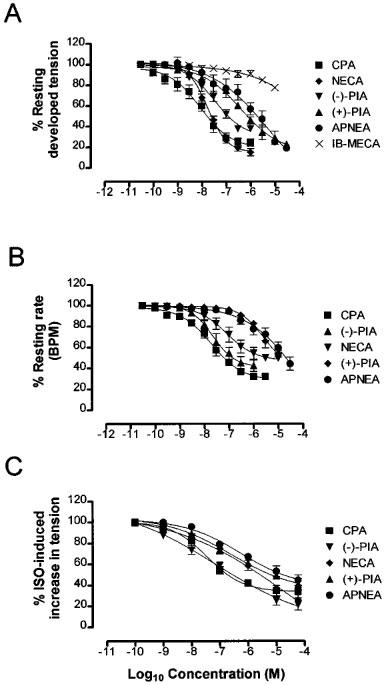
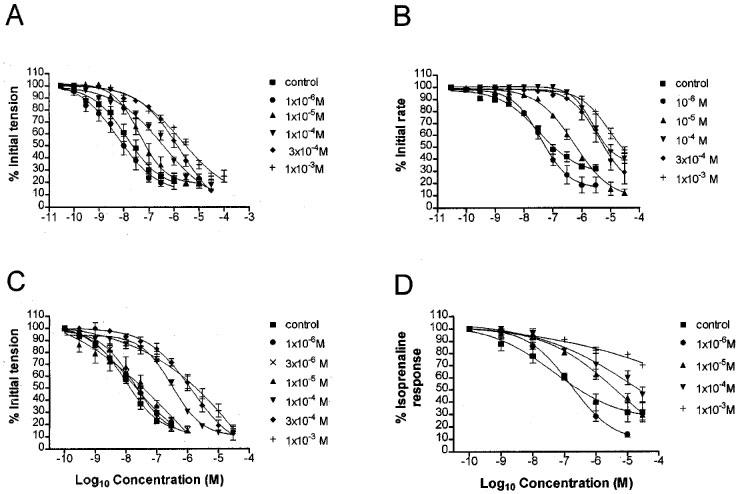
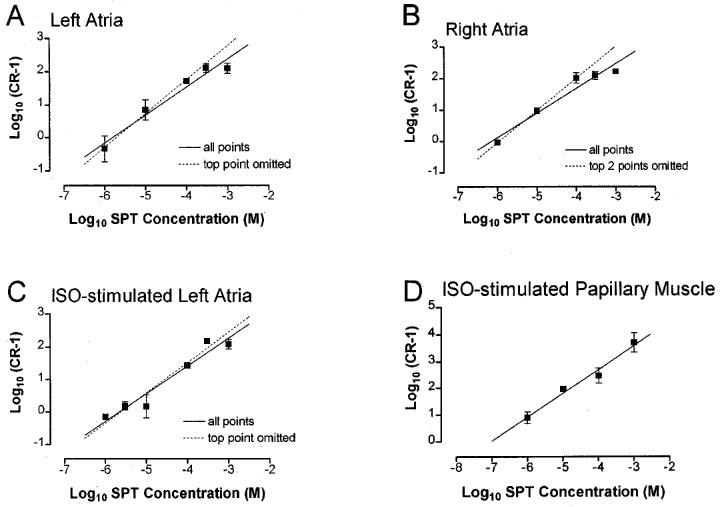
1. Adenosine receptor(s) mediating negative inotropy of paced left atria, isoprenaline-stimulated paced left atria and papillary muscles, and negative chronotropy of spontaneously beating right atria were characterized. 2. Isometric tension of guinea-pig isolated paced left atria and left ventricular papillary muscles and rate of contraction of spontaneously beating right atria were recorded. Papillary muscles were pre-stimulated with isoprenaline (1x10⁻⁸ M). Concentration-response curves (CRCs) for tension or rate reduction by N6-cyclopentyladenosine (CPA), the stereoisomers of N6-(2-phenylisopropyl)adenosine ((+)-PIA and (-)-PIA), 5'-(N-carboxamido)adenosine (NECA), N6-2-(4-aminophenyl)ethyladenosine (APNEA) and N6-(3-iodobenzyl)adenosine-5'-N-methyuromide (IB-MECA) revealed a potency order of CPA=(-)-PIA>NECA in right atria and papillary muscles, which is consistent with involvement of A1-receptors. The potency order in left atria was CPA=NECA>(-)-PIA>(+)-PIA>APNEA, which is not typical of A1 adenosine receptors. Weak activity of APNEA and IB-MECA discounts involvement of A3 receptors. 3. pA2 values for the antagonism of CPA by 8(p-sulfophenyl)theophylline (8-SPT) were calculated from Schild plots (log concentration-ratio against log 8-SPT concentration), the unity slopes of which indicated competitive antagonism. The pA2 value in the papillary muscles was significantly higher than for atrial preparations, indicating a possible difference in receptor characteristics between atrial and papillary muscle responses. 4. In left and right atria there was a limit to the displacement of the CPA CRCs at higher concentrations of 8-SPT. The 8-SPT-resistant component of the response is suggested to arise from duality of coupling of a common A1 receptor through either different G proteins or G protein subunits to independent transduction pathways. The results with papillary muscles can be explained by a typical A1 receptor coupled to a single transduction pathway.
Figures
References
-
- BELARDINELLI L., ISENBERG G. Isolated atrial myocytes: adenosine and acetylcholine increase potassium conductance. Am. J. Physiol. 1983;224:H734–H737. - PubMed
-
- BÖHM M., BRUCKNER R., MEYER W., NOSE M., SCHMITZ W., SCHOLZ H., STARBATTY J. Evidence for adenosine receptor-mediated isoprenaline-antagonistic effects of the adenosine analogs PIA and NECA on force of contraction in guinea-pig atrial and ventricular cardiac preparations. Naunyn-Schmiedeberg's Arch. Phamacol. 1985;331:131–139. - PubMed
-
- BOLTON S. Pharmaceutical Statistics 199044New York: Marcel Dekker INC; 2nd ed
Publication types
MeSH terms
Substances
Grants and funding
LinkOut - more resources
Full Text Sources
