. 1999 Sep 1;519 Pt 2(Pt 2):451-66.
doi: 10.1111/j.1469-7793.1999.0451m.x.

Glutamate-induced mitochondrial depolarisation and perturbation of calcium homeostasis in cultured rat hippocampal neurones

Affiliations

Glutamate-induced mitochondrial depolarisation and perturbation of calcium homeostasis in cultured rat hippocampal neurones

O Vergun et al. J Physiol. .

Abstract

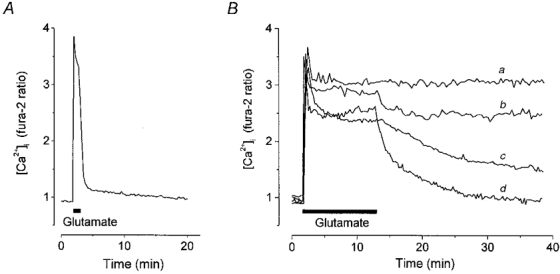
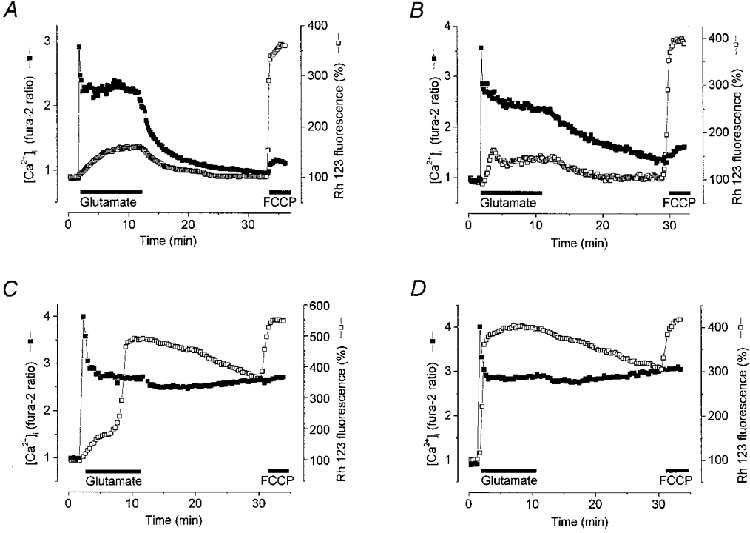
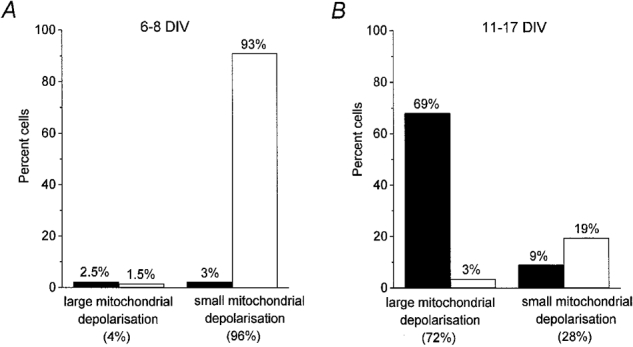
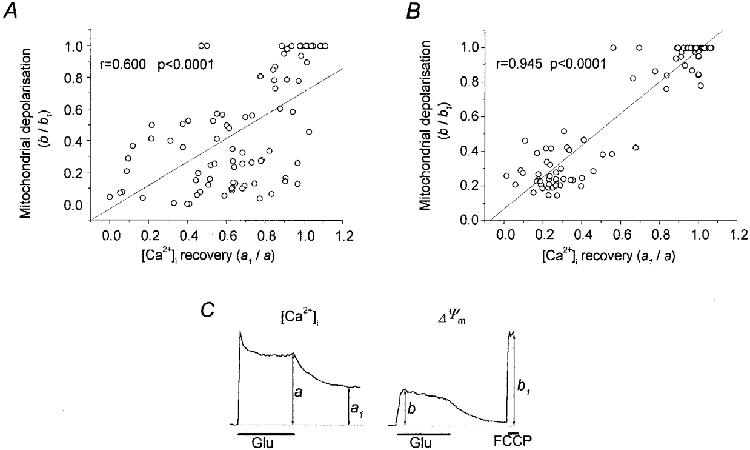
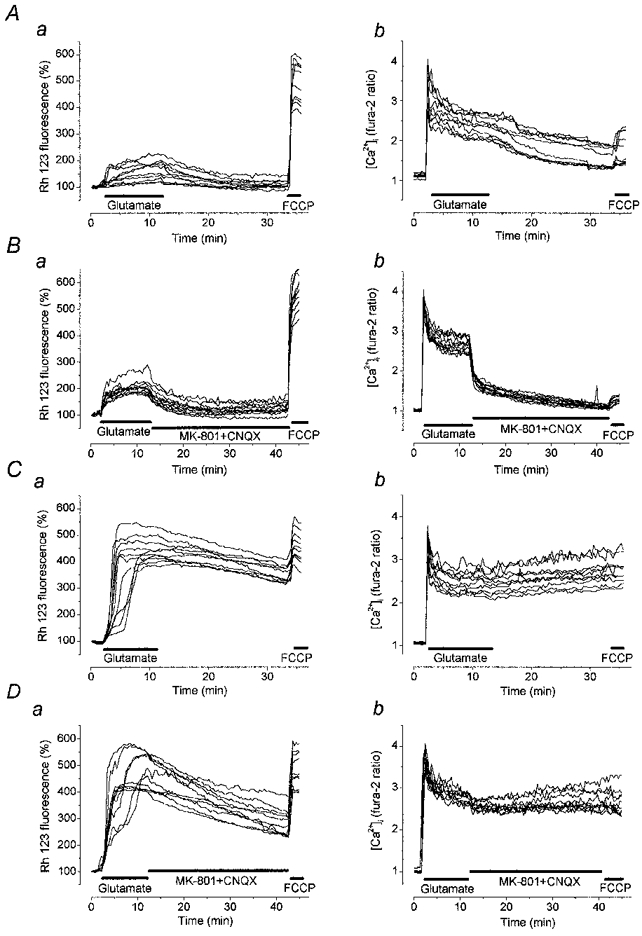
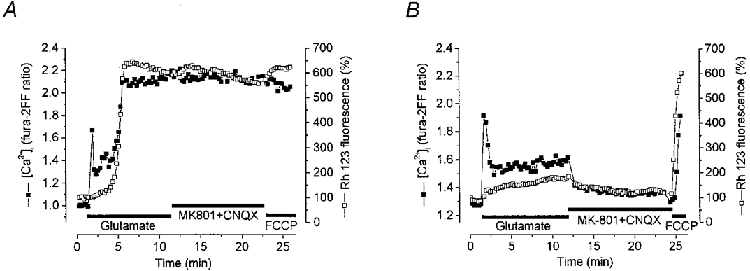
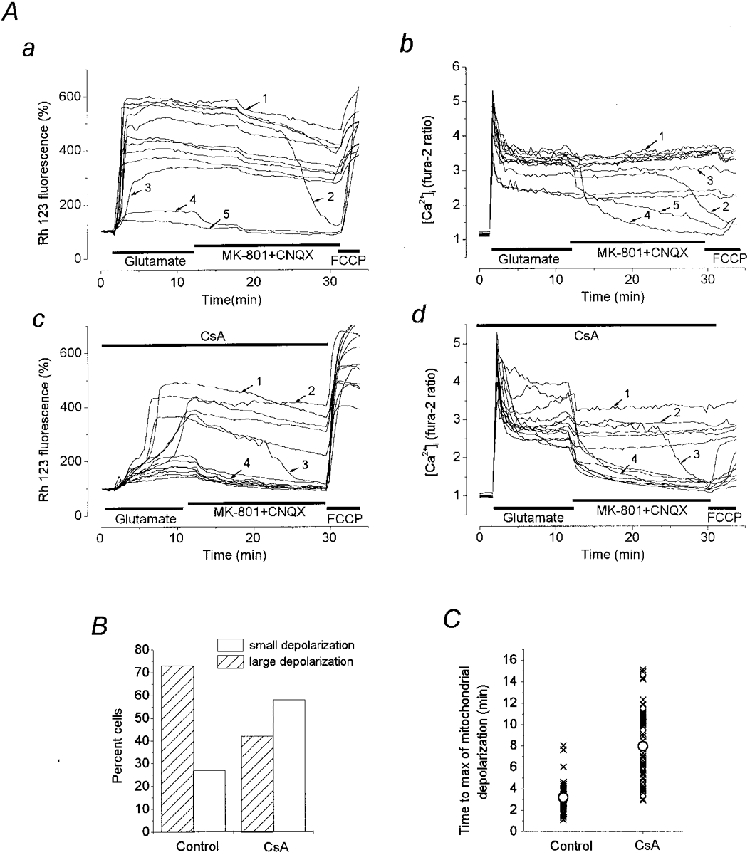
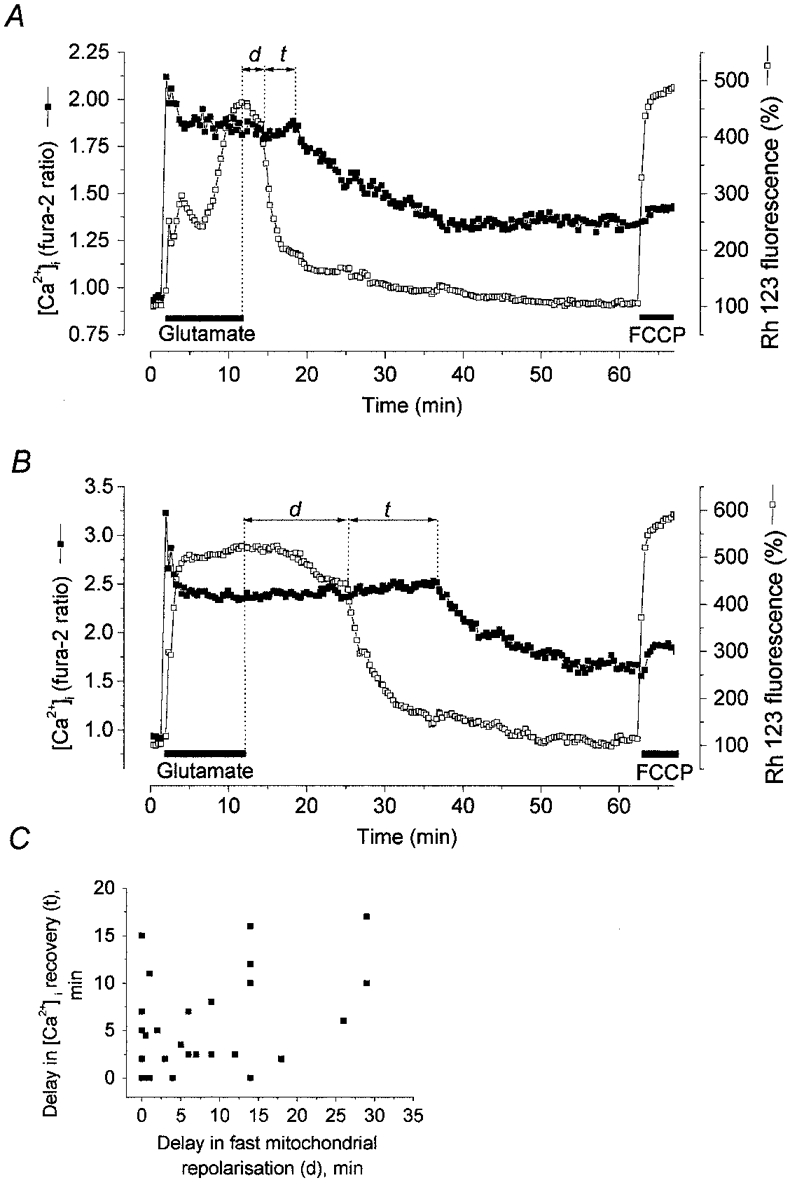
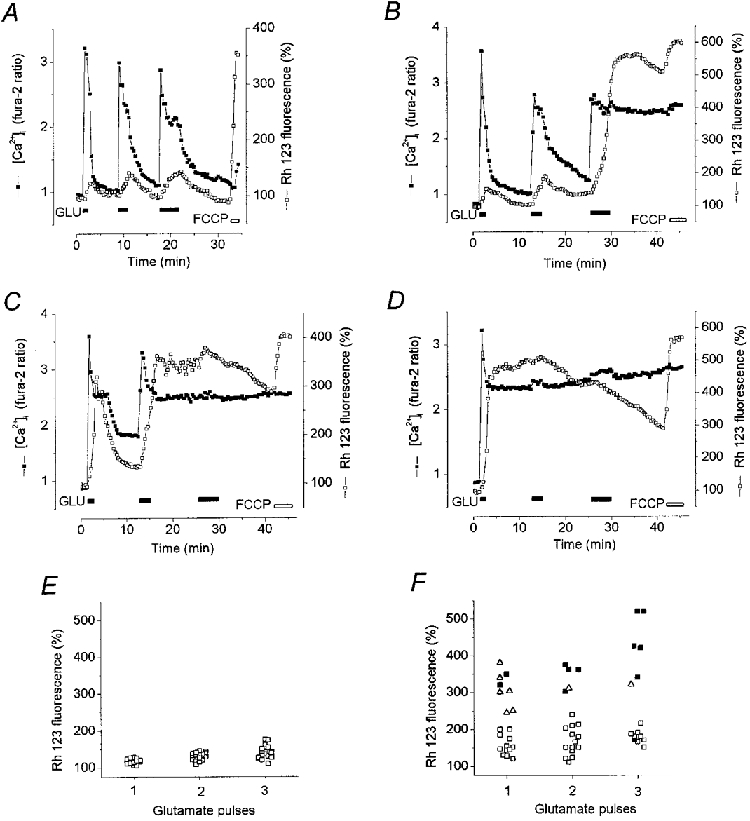
1. The objective of this study was to clarify the relationships between loss of mitochondrial potential and the perturbation of neuronal Ca2+ homeostasis induced by a toxic glutamate challenge. Digital fluorescence imaging techniques were employed to monitor simultaneously changes in cytoplasmic Ca2+ concentration ([Ca2+]i) and mitochondrial potential (DeltaPsim) in individual hippocampal neurones in culture coloaded with fura-2 AM or fura-2FF AM and rhodamine 123 (Rh 123). 2. In most cells (96 %) at 6-7 days in vitro (DIV) and in a small proportion of cells (29 %) at 11-17 DIV the [Ca2+]i increase induced by exposure to 100 microM glutamate for 10 min was associated with a small mitochondrial depolarisation, followed by mitochondrial repolarisation, and a degree of recovery of [Ca2+]i following glutamate washout. In the majority of neurones at 11-17 DIV (71 %), exposure to glutamate for 10 min induced a profound mono- or biphasic mitochondrial depolarisation, which was clearly correlated with a sustained [Ca2+]i plateau despite the removal of glutamate. 3. Addition of glutamate receptor antagonists (15 microM MK-801 plus 75 microM 6-cyano-7-nitroquinoxaline-2, 3-dione (CNQX)) to the washout solution did not affect the post-glutamate [Ca2+]i plateau in neurones exhibiting a profound mitochondrial depolarisation but greatly improved [Ca2+]i recovery in those neurones undergoing only a small mitochondrial depolarisation, suggesting that the release of endogenous glutamate delays [Ca2+]i recovery in the postglutamate period. 4. Cyclosporin A (500 nM) or N-methyl Val-4-cyclosporin A (200 nM) delayed or even prevented the development of the second phase of mitochondrial depolarisation in cells at 11-17 DIV and increased the proportion of neurones exhibiting a small monophasic mitochondrial depolarisation and [Ca2+]i recovery upon glutamate removal. 5. We have thus described a striking correlation between mitochondrial depolarisation and the failure of cells to restore [Ca2+]i following a toxic glutamate challenge. These data suggest that mitochondrial dysfunction plays a major role in the deregulation of [Ca2+]i associated with glutamate toxicity.


Figures

Figure 1
Figure 1. The kinetics of [Ca2+]i recovery following a glutamate challenge varies between cells and depends on the duration of glutamate exposure
Cultured hippocampal neurones were stimulated with 100 μm glutamate (in a solution containing 0 Mg2+ and 10 μm glycine). A, representative trace showing the response of a neurone at 7 DIV to stimulation for 1 min. The decay phase showed biphasic kinetics of [Ca2+]i recovery and was well fitted by a double exponential process with time constants τfast= 0.48 min and τslow= 14.47 min and relative amplitudes (A) of the fast and slow components Afast= 0.92 and Aslow= 0.08. B, representative traces showing the responses of 4 individual neurones at 11 DIV (a and b) and 7 DIV (c and d) with different patterns of [Ca2+]i recovery following glutamate stimulation for 10 min: a, ‘plateau response’; b and c, delayed and d, complete [Ca2+]i recovery.
Figure 2
Figure 2. Relationships between [Ca2+]i and mitochondrial potential (ΔΨm) during and after exposure to glutamate for 10 min
Simultaneous measurements of changes in the fura-2 ratio (▪) and relative Rh 123 fluorescence (□) were made from single neurones. Glutamate (100 μm) and glycine (10 μm) were applied in a Mg2+-free solution. An increase in Rh 123 fluorescence reflects mitochondrial depolarisation. A and B show different dynamics of [Ca2+]i recovery in single neurones at 7 DIV (A) and 8 DIV (B) exhibiting small mitochondrial depolarisations. C and D present exemplar neurones at 16 DIV in which large glutamate-induced mitochondrial depolarisations were seen. A large mitochondrial depolarisation was associated with a post-glutamate [Ca2+]i plateau. The mitochondrial uncoupler FCCP (1 μm) was applied at the end of this and subsequent experiments to indicate the level of fluorescence of Rh 123 that reflected complete dissipation of ΔΨm.
Figure 3
Figure 3. Relationship between the post-glutamate [Ca2+]i plateau, the degree of mitochondrial depolarisation and the age of the culture
Neurones at each developmental stage (6-8 and 11-17 DIV) were subdivided into two groups. The total number of neurones was taken as 100 %. Neurones showing a less than 2-fold increase in Rh 123 fluorescence during glutamate exposure were included in the groups with small mitochondrial depolarisation; neurones in which glutamate produced an up to 6-fold increase of basal Rh 123 fluorescence were included in the groups with large mitochondrial depolarisation. The columns show the proportion of neurones exhibiting a [Ca2+]i plateau (▪) or [Ca2+]i recovery (□). The groups of neurones with a [Ca2+]i recovery include cells exhibiting either a partial or complete recovery (see Fig. 1B, traces b-d). A and B represent data from 135 neurones at 6-8 DIV and 275 neurones at 11-17 DIV. Clearly a [Ca2+]i plateau (‘no recovery’) was observed in the majority of cells with a large mitochondrial depolarisation, while a degree of [Ca2+]i recovery occurred in the majority of cells with a small mitochondrial depolarisation.
Figure 4
Figure 4. Relationship between the degree of mitochondrial depolarisation during glutamate exposure and the postglutamate [Ca2+]i dynamics in the presence and absence of glutamate receptor antagonists
Each symbol in A and B corresponds to an individual hippocampal neurone. A, data from 7 experiments (86 neurones) in which the washout solution did not contain glutamate receptor antagonists. B, data from 6 experiments (103 neurones) in which the washout solution contained 15 μm MK-801 and 75 μm CNQX. In C, a schematic representation is shown to illustrate how the measurements of maximum glutamate-induced mitochondrial depolarisation and the extent of [Ca2+]i recovery were made; a and a1, fura-2 fluorescence ratio (340 nm/380 nm) at the end of the glutamate challenge and 10 min after glutamate washout, respectively; b and b1, maximal Rh 123 fluorescence during glutamate exposure and in response to a pulse of FCCP (1 μm).
Figure 5
Figure 5. Contribution of endogenous excitatory amino acids (enEAA) to delayed [Ca2+]i recovery on glutamate washout
These traces show simultaneous recordings of Rh 123 fluorescence (left-hand panels, a) and [Ca2+]i (right-hand panels, b) in cultures at 13 DIV. The records from neurones exhibiting small and large mitochondrial depolarisation in response to glutamate were plotted separately in A and B, and in C and D, respectively. Aa and b show the responses to glutamate typical of neurones with a small mitochondrial depolarisation followed by washout with control saline. In B, the glutamate receptor antagonists MK-801 (15 μm) and CNQX (75 μm) were added to the washout, and greatly enhanced recovery of the [Ca2+]i signal. C, in neurones with a large mitochondrial depolarisation, [Ca2+]i remained at a high plateau in the postglutamate period and washout of glutamate with the glutamate receptor antagonists (D) had no effect on the postglutamate [Ca2+]i plateau.
Figure 6
Figure 6. Relationships between [Ca2+]i and ΔΨm in hippocampal neurones coloaded with fura-2FF and Rh 123
Simultaneous measurements of [Ca2+]i (▪) using fura-2FF and of ΔΨm (□) in neurones at 16 DIV (A) and 8 DIV (B). Glutamate application caused a brisk transient rise in [Ca2+]i followed by a secondary rise to a high plateau level which was sustained on glutamate washout despite the presence of the glutamate receptor antagonists. The secondary rise in [Ca2+]i was accompanied by a profound mitochondrial depolarisation. In the record shown in B, glutamate caused a transient increase in [Ca2+]i very similar in amplitude to that seen in A but associated with a very small, slow mitochondrial depolarisation and a sustained low [Ca2+]i signal which recovered completely on glutamate washout with the addition of receptor antagonists.
Figure 9
Figure 9. Effects of cyclosporin A (CsA) on glutamate-induced mitochondrial depolarisation and [Ca2+]i dynamics
Simultaneous measurements of [Ca2+]i and ΔΨm in neurones at 16 DIV are shown. The glutamate antagonists MK-801 (15 μm) and CNQX (75 μm) were added to the washout solution to exclude the effect of enEAA on the post-glutamate [Ca2+]i recovery. Aa and b show [Ca2+]i and ΔΨm dynamics during and after glutamate exposure in a matched control experiment while Ac and d show [Ca2+]i and ΔΨm dynamics in neurones of a sister culture preincubated with 0.5 μm CsA for 50 min at room temperature. CsA was present in all the solutions used during the experiment. B, histogram showing that CsA decreased the number of neurones exhibiting a large glutamate-induced mitochondrial depolarisation (from 73 % in control culture to 43 % in CsA-treated culture) and correspondingly increased the percentage of neurones with a small mitochondrial depolarisation. C shows the scatter of time-to-peak measurements of the glutamate-induced mitochondrial depolarisation (measured from the beginning of the glutamate application) in the control cells and in cells treated with CsA. Each symbol (×) corresponds to the individual neurone with ○ being the mean value in each group. The mean value was 3.16 ± 0.20 min (n = 46) in the control, and 7.96 ± 0.44 min (n = 57) in the CsA treated group.
Figure 7
Figure 7. Relationships between the dynamics of mitochondrial repolarisation and postglutamate [Ca2+]i recovery
[Ca2+]i (▪) and ΔΨm (□) were monitored simultaneously in cells at 14 DIV coloaded with fura-2 and Rh 123. Representative records are shown to illustrate mitochondrial repolarisation with accompanying [Ca2+]i recovery. A and B show examples of a partial [Ca2+]i recovery following fast mitochondrial repolarisation after a short (A) and long (B) delay. C, relationship between the delay of a fast mitochondrial repolarisation (d) and the delay of [Ca2+]i recovery (t) following a 10 min glutamate exposure; each symbol corresponds to the d and t in the individual cells. The large mitochondrial response to 1 μm FCCP at the end of the experiment testifies that the decrease in Rh 123 fluorescence reflected mitochondrial repolarisation and not dye leakage from the cell.
Figure 8
Figure 8. Relationships between changes in [Ca2+]i and ΔΨm induced by repeated glutamate pulses of different duration
Neurones at 6 DIV (A) and 16 DIV (B-D) were stimulated with sequential 1, 2 and 4 min pulses of 100 μm glutamate separated by 6 min (A) and 10 min (B-D) intervals. [Ca2+]i (▪) and ΔΨm (□) were monitored simultaneously. The record in A shows responses representative of those seen in cells at 6 DIV (n = 20). An increase in the glutamate pulse duration from 1 to 2 and then to 4 min slowed but did not prevent [Ca2+]i recovery. B-D show representative records from a similar experiment with neurones at 16 DIV(n = 21). The plots shown in E and F summarise the data of 2 experiments on neurones at 6 (E) and 16 DIV (F) presented in A-D in terms of the [Ca2+]i dynamics. Each symbol shows the response of an individual neurone to the first, second and third glutamate pulses: □, transient [Ca2+]i response; ▵, delayed [Ca2+]i recovery (as shown in C);▪, [Ca2+]i plateau response. Ordinate, degree of mitochondrial depolarisation (Rh 123 fluorescence in %).

References

    1. Adamec E, Didier M, Nixon R. Developmental regulation of the recovery process following glutamate-induced calcium rise in rodent primary neuronal cultures. Developmental Brain Research. 1998;108:101–110. - PubMed
    1. Ankarcrona M, Dypbukt JM, Orrenius S, Nicotera P. Calcineurin and mitochondrial function in glutamate-induced neuronal cell death. FEBS Letters. 1996;394:321–324. - PubMed
    1. Augustine GJ, Neher E. Neuronal Ca2+ signalling takes the local route. Current Opinion in Neurobiology. 1992;2:302–307. - PubMed
    1. Bindokas VP, Jordan J, Lee CC, Miller RJ. Superoxide production in rat hippocampal neurons: selective imaging with hydroethidine. Journal of Neuroscience. 1996;16:1324–1336. - PMC - PubMed
    1. Bogachev A, Bykova L, Khodorov B, Andreeva N, Khaspekov L, Pinelis V, Victorov I. Stable decrease in ATP contents in cultured cerebellar and hippocampal neurons during and after toxic glutamate treatment. Biological Membranes. 1992;9:1057–1059. in Russian.

Publication types

LinkOut - more resources