. 1999 Aug 23;146(4):709-22.
doi: 10.1083/jcb.146.4.709.

Mcm2, but not RPA, is a component of the mammalian early G1-phase prereplication complex

Affiliations

Mcm2, but not RPA, is a component of the mammalian early G1-phase prereplication complex

D S Dimitrova et al. J Cell Biol. .

Abstract

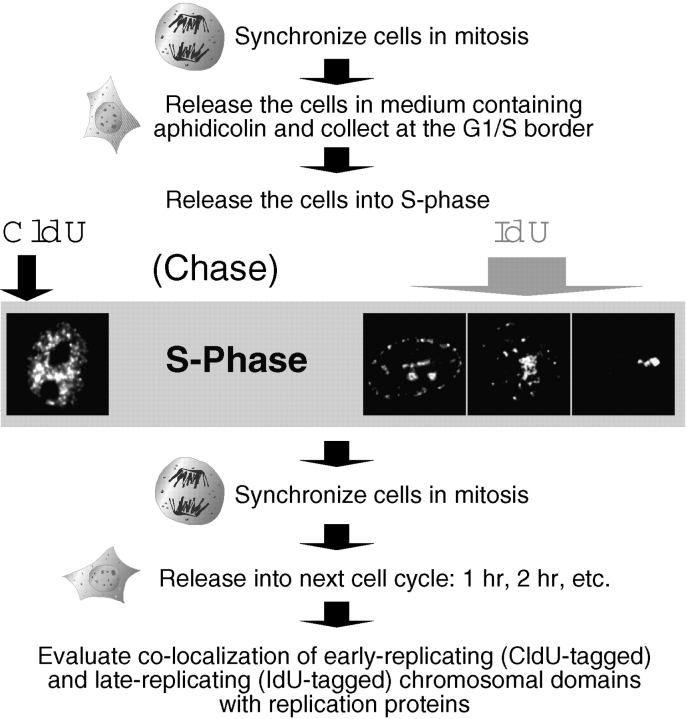
Previous experiments in Xenopus egg extracts identified what appeared to be two independently assembled prereplication complexes (pre-RCs) for DNA replication: the stepwise assembly of ORC, Cdc6, and Mcm onto chromatin, and the FFA-1-mediated recruitment of RPA into foci on chromatin. We have investigated whether both of these pre-RCs can be detected in Chinese hamster ovary (CHO) cells. Early- and late-replicating chromosomal domains were pulse-labeled with halogenated nucleotides and prelabeled cells were synchronized at various times during the following G1-phase. The recruitment of Mcm2 and RPA to these domains was examined in relation to the formation of a nuclear envelope, specification of the dihydrofolate reductase (DHFR) replication origin and entry into S-phase. Mcm2 was loaded gradually and cumulatively onto both early- and late-replicating chromatin from late telophase throughout G1-phase. During S-phase, detectable Mcm2 was rapidly excluded from PCNA-containing active replication forks. By contrast, detergent-resistant RPA foci were undetectable until the onset of S-phase, when RPA joined only the earliest-firing replicons. During S-phase, RPA was present with PCNA specifically at active replication forks. Together, our data are consistent with a role for Mcm proteins, but not RPA, in the formation of mammalian pre-RCs during early G1-phase.


Figures

Figure 1
Figure 1
Experimental protocol (see text for details). Representative photographs of the types of replication patterns prevailing in the early (first half, euchromatic) or late (second half, three sequential heterochromatic patterns) stages of the 10–12 h S-phase in CHOC 400 cells are displayed.
Figure 2
Figure 2
Mcm2 associates with both early-replicating (A and upper row in C) and late-replicating (B and lower row in C) chromatin at the beginning of G1-phase and is released from chromosomal domains at the time when they replicate. CHOC 400 cells, pulse-labeled with CldU during the first 5 min of S-phase and with IdU after 8 h in the same S-phase, were collected in the following mitosis and released in the subsequent cell cycle (see Fig. 1). Aliquots of the cells were then collected at 2 h (pre-ODP) or 6 h (post-ODP) in G1-phase, whereas the remainder of the cells were arrested at the G1/S boundary with aphidicolin and either collected immediately (Aph-blocked) or released for 5 min, 3 h (early-S-phase), or 8 h (late-S-phase). The cells were extracted with 0.5% Triton X-100, fixed with formaldehyde and immunostained with anti-Mcm2 antibody (red) and either anti-CldU (A and upper row in C, green) or anti-IdU (B and lower row in C, green) antibodies as described in Materials and Methods. The images displayed in A and B were obtained by conventional epifluorescence microscopy and were scanned directly from photographs taken with a dual FITC/Rhodamine (Merge) or single FITC (CldU or IdU) or TxRed (Mcm2) fluorescence filters. Shown in part C are single optical sections through cells from the same synchronized cultures obtained by dual-color confocal laser scanning microscopy as described in Materials and Methods. (D) Origin mapping at the DHFR locus by the ELFH assay was performed by introducing aliquots of the same cells, taken at 2 h circles and 6 h squares after release from mitosis, into Xenopus egg extract as described in Materials and Methods. The relative amounts of hybridization of the earliest labeled nascent DNA to each probe from the DHFR locus are plotted against the map position of each probe. The horizontal axis includes diagrams of the genomic region encompassed by these probes, including the positions of the DHFR and 2BE2121 genes (Hamlin et al. 1994). The vertical shaded line highlights the positions of probes B-R, which encompass the region of peak initiation activity (Kobayashi et al. 1998; Wang et al. 1998) and references therein).
Figure 2
Figure 2
Mcm2 associates with both early-replicating (A and upper row in C) and late-replicating (B and lower row in C) chromatin at the beginning of G1-phase and is released from chromosomal domains at the time when they replicate. CHOC 400 cells, pulse-labeled with CldU during the first 5 min of S-phase and with IdU after 8 h in the same S-phase, were collected in the following mitosis and released in the subsequent cell cycle (see Fig. 1). Aliquots of the cells were then collected at 2 h (pre-ODP) or 6 h (post-ODP) in G1-phase, whereas the remainder of the cells were arrested at the G1/S boundary with aphidicolin and either collected immediately (Aph-blocked) or released for 5 min, 3 h (early-S-phase), or 8 h (late-S-phase). The cells were extracted with 0.5% Triton X-100, fixed with formaldehyde and immunostained with anti-Mcm2 antibody (red) and either anti-CldU (A and upper row in C, green) or anti-IdU (B and lower row in C, green) antibodies as described in Materials and Methods. The images displayed in A and B were obtained by conventional epifluorescence microscopy and were scanned directly from photographs taken with a dual FITC/Rhodamine (Merge) or single FITC (CldU or IdU) or TxRed (Mcm2) fluorescence filters. Shown in part C are single optical sections through cells from the same synchronized cultures obtained by dual-color confocal laser scanning microscopy as described in Materials and Methods. (D) Origin mapping at the DHFR locus by the ELFH assay was performed by introducing aliquots of the same cells, taken at 2 h circles and 6 h squares after release from mitosis, into Xenopus egg extract as described in Materials and Methods. The relative amounts of hybridization of the earliest labeled nascent DNA to each probe from the DHFR locus are plotted against the map position of each probe. The horizontal axis includes diagrams of the genomic region encompassed by these probes, including the positions of the DHFR and 2BE2121 genes (Hamlin et al. 1994). The vertical shaded line highlights the positions of probes B-R, which encompass the region of peak initiation activity (Kobayashi et al. 1998; Wang et al. 1998) and references therein).
Figure 3
Figure 3
PCNA does not bind nuclear components during G1-phase and associates transiently with chromosomal domains at the time when they replicate. (A) The association of PCNA (red) with the earliest-replicating chromatin regions (CldU-tagged, green) was examined in aliquots of the cells used in the experiment displayed in Fig. 2. (B) Late-replicating genomic regions were pulse-labeled with CldU (green) at 8 h in S-phase in a parallel culture of CHOC 400 cells, mitotic cells were collected few hours later, released in the subsequent cell cycle for the same periods of time and processed in the same way as in Fig. 2.
Figure 4
Figure 4
RPA, but not Mcm2, is present at PCNA-containing active mammalian replication forks. Aliquots of the cell cultures (synchronized in early or mid/late S-phase) used in Fig. 2 were immunostained with PCNA-specific (red) and, either Mcm2-specific (A, green), or RPA-specific (B, green) antibodies. Shown are single sections obtained by dual-color confocal laser scanning microscopy.
Figure 5
Figure 5
Variations in the amount of chromatin-bound Mcm2 and PCNA during different stages of the cell cycle in CHOC 400 cells. Synchronized cell populations were resuspended in cytoskeleton buffer (for Triton extractions) or transport buffer (for digitonin extractions) and incubated for 5 min on ice with or without addition of permeabilizing agents as described in Materials and Methods. The cellular or nuclear pellets (P) were separated from the soluble fractions (S) by centrifugation. The proteins from each fraction (only the pellets were analyzed in the case of digitonin extractions) were separated by electrophoresis in 10% (A, B, C-Mcm2, and D) or 18% (C, PCNA) SDS–polyacrylamide gels (amounts corresponding to 2 × 10⁵ cells were loaded in each lane), transferred to nylon membranes and probed with an anti-Mcm2 antibody (A–D) or anti-PCNA antibody (C, PCNA and F). (A) Immunoblotting analysis of chromatin-bound Mcm2 at 20, 40, and 60 min after release of CHOC 400 cells from metaphase block. The percentages of cells in different stages of mitosis, determined microscopically after staining aliquots of the synchronized cells with 0.1 μg/ml 4′,6-diamidino-2-phenylindole (DAPI), are indicated on the right for each time point. (B) Immunoblot analysis of chromatin-bound Mcm2 at different times during interphase. The permeabilization of cells with 70 μg/ml digitonin produces nuclei with intact membranes and can be used as a reference for the total amount of nuclear Mcm2 proteins. The relative amounts of chromatin-bound Mcm2 proteins at each time point analyzed were estimated by comparing serial dilutions of the soluble fractions run in parallel to an aliquot of the Triton-resistant fraction and are indicated on the right. (C) Western blots of total CHOC400 cellular protein extract probed with anti-Mcm2 or anti-PCNA antibodies. Positions of molecular mass standards (indicated in kD) are marked on the left of each blot. (D) Hamster Mcm2, like human BM28/Mcm2 (Todorov et al. 1995), exists as different isoforms. A lighter exposure of immunoblots probed with Mcm2-specific antibodies reveals that Mcm2 proteins can be resolved as a doublet of bands (marked with stars) in the soluble protein fraction. Only a slow moving form is detected in the nuclear pellet fraction. (E) Immunofluorescent analysis of Mcm2 chromatin-binding in Triton-extracted CHOC 400 cells at different stages of mitosis. Asynchronous cells grown on coverslips were extracted with 0.5% Triton in CSK buffer for 2 min on ice, fixed with formaldehyde, and immunostained for Mcm2 as in Fig. 2. DNA was stained with DAPI as in A. The arrowheads point to cells in prophase (i) and (iv), metaphase (ii) and (v), and late telophase (iii) and (vi). The arrows point to a cell in late anaphase/early telophase (iii) and (vi). (F) Immunoblot analysis of chromatin-bound PCNA at different times during interphase. The same protein blots used in B were probed with a PCNA-specific antibody. An increase in the total amount of cellular PCNA at the beginning of S-phase is evident, consistent with previously reported data on human PCNA (Morris and Mathews 1989). The level of chromatin-bound PCNA increased after release into S-phase and maximal amount of insoluble PCNA was detected during early S-phase.
Figure 6
Figure 6
Hamster RPA does not assemble into detergent-resistant pre-RC foci during early G1-phase and associates transiently with chromosomal domains at the specific time of S-phase when they replicate. The association of RPA (red), with earliest-replicating (CldU, green, A) or late-replicating (IdU, green, B) chromatin regions was examined in aliquots of the cells used in Fig. 2. Immunolabeling was performed as in Fig. 2.
Figure 7
Figure 7
Immunoblot analysis of chromatin-bound RPA during G1 and S-phase. (A) Proteins in a total extract from CHOC 400 cells (2.5 × 10⁵ cells) were separated by electrophoresis in 12.5% SDS–polyacrylamide gels, transferred to a nylon membrane and probed with anti-RPA antibodies. The rabbit polyclonal anti-RPA serum [raised against human RPA trimeric complex (Din et al. 1990)] recognized protein bands corresponding to the large (apparent molecular mass of ∼70 kD), middle (∼30 kD), and small (∼14 kD, a very faint band invisible on this blot) RPA subunits. Positions of molecular mass standards (indicated in kD) are marked on the left. (B) Western blots of chromatin-bound RPA in early G1 and S-phase. Aliquots of the same protein extracts from synchronized CHOC 400 cells used in Fig. 5B and Fig. F, were subjected to SDS-PAGE (12.5% polyacrylamide gels, equivalents of 2 × 10⁵ cell per lane), transferred to nylon membranes and probed with anti-RPA polyclonal antibodies. Only results for the middle (p30) and large (p70) RPA subunits are displayed, since the signal for the small RPA subunit was very weak (we have found no evidence for disassembly of the RPA complex during the cell cycle in control immunolocalization experiments, using monoclonal antibodies specific for the individual RPA subunits together with the polyclonal serum against the heterotrimeric RPA complex; Dimitrova, D.S., and D.M. Gilbert, manuscript in preparation). An increase of total cellular RPA protein and a maximal level of RPA in the nuclear pellet fraction was detected during early S-phase (see Fig. 5 F).
Figure 7
Figure 7
Immunoblot analysis of chromatin-bound RPA during G1 and S-phase. (A) Proteins in a total extract from CHOC 400 cells (2.5 × 10⁵ cells) were separated by electrophoresis in 12.5% SDS–polyacrylamide gels, transferred to a nylon membrane and probed with anti-RPA antibodies. The rabbit polyclonal anti-RPA serum [raised against human RPA trimeric complex (Din et al. 1990)] recognized protein bands corresponding to the large (apparent molecular mass of ∼70 kD), middle (∼30 kD), and small (∼14 kD, a very faint band invisible on this blot) RPA subunits. Positions of molecular mass standards (indicated in kD) are marked on the left. (B) Western blots of chromatin-bound RPA in early G1 and S-phase. Aliquots of the same protein extracts from synchronized CHOC 400 cells used in Fig. 5B and Fig. F, were subjected to SDS-PAGE (12.5% polyacrylamide gels, equivalents of 2 × 10⁵ cell per lane), transferred to nylon membranes and probed with anti-RPA polyclonal antibodies. Only results for the middle (p30) and large (p70) RPA subunits are displayed, since the signal for the small RPA subunit was very weak (we have found no evidence for disassembly of the RPA complex during the cell cycle in control immunolocalization experiments, using monoclonal antibodies specific for the individual RPA subunits together with the polyclonal serum against the heterotrimeric RPA complex; Dimitrova, D.S., and D.M. Gilbert, manuscript in preparation). An increase of total cellular RPA protein and a maximal level of RPA in the nuclear pellet fraction was detected during early S-phase (see Fig. 5 F).
Figure 8
Figure 8
Hamster RPA and PCNA are assembled into detergent-resistant replicative complexes within less than an hour from the start of S-phase. CHOC 400 cells, synchronized in mitosis, were released for 8 h in the following cell cycle (20% of the cells had entered S-phase at this time). The cells were pulse-labeled with 100 μM CldU for 1 min, extracted with Triton and fixed with formaldehyde as described in Materials and Methods. Aliquots of the cells were stained with anti-CldU antibodies (green) and either anti-RPA antibodies (red, A) or anti-PCNA antibodies (red, B). S-phase cells display yellow coloration resulting from the colocalization of RPA or PCNA (red) with nascent DNA (CldU, green). Arrowheads point to nuclei that exhibit positive staining for RPA or PCNA, but no CldU label. Arrows indicate the positions of G1-phase cells (barely visible as faint shadows).

Similar articles

Cited by

References

    1. Adachi Y., Laemmli U.K. Identification of nuclear pre-replication centers poised for DNA synthesis in Xenopus egg extractsimmunolocalization study of replication protein A. J. Cell Biol. 1992;119:1–15. - PMC - PubMed
    1. Adachi Y., Laemmli U.K. Study of the cell cycle-dependent assembly of the DNA pre-replication centres in Xenopus egg extracts. EMBO (Eur. Mol. Biol. Organ.) J. 1994;13:4153–4164. - PMC - PubMed
    1. Aparicio O.M., Weinstein D.M., Bell S.P. Components and dynamics of DNA replication complexes in S. cerevisiaeredistribution of MCM proteins and Cdc45p during S phase. Cell. 1997;91:59–69. - PubMed
    1. Aten J.A., Bakker P.J.M., Stap J., Boschman G.A., Veenhof C.H.N. DNA double labelling with IdUrd and CldUrd for spatial and temporal analysis of cell proliferation and DNA replication. Histochem. J. 1992;24:251–259. - PubMed
    1. Bakker P.J., Stap J., Tukker C.J., van Oven C.H., Veenhof C.H., Aten J. An indirect immunofluorescence double staining procedure for the simultaneous flow cytometric measurement of iodo- and chlorodeoxyuridine incorporated into DNA. Cytometry. 1991;12:366–372. - PubMed

Publication types

MeSH terms