. 1999 Sep 1;19(17):7591-602.
doi: 10.1523/JNEUROSCI.19-17-07591.1999.

Effects of attention on the processing of motion in macaque middle temporal and medial superior temporal visual cortical areas

Affiliations

Effects of attention on the processing of motion in macaque middle temporal and medial superior temporal visual cortical areas

S Treue et al. J Neurosci. .

Abstract

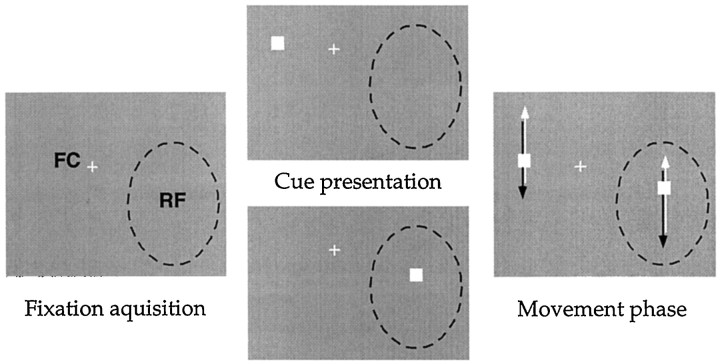
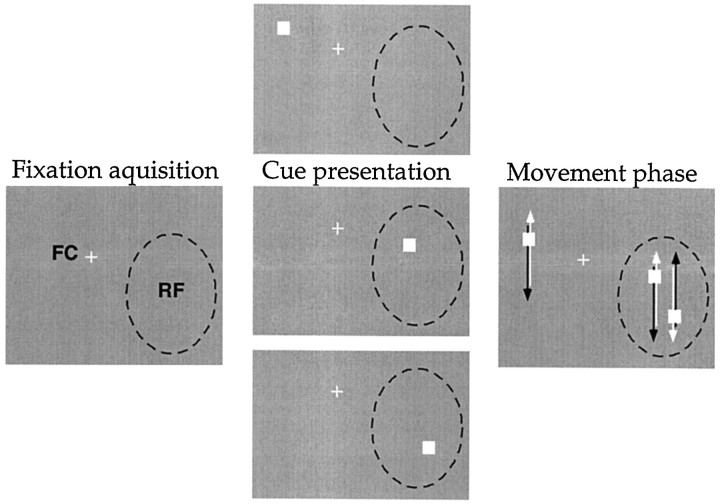
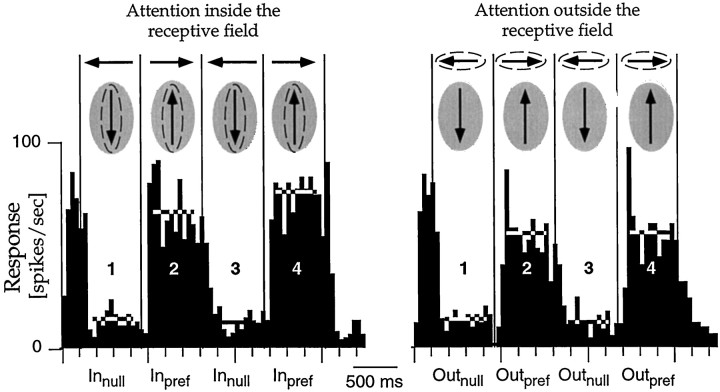
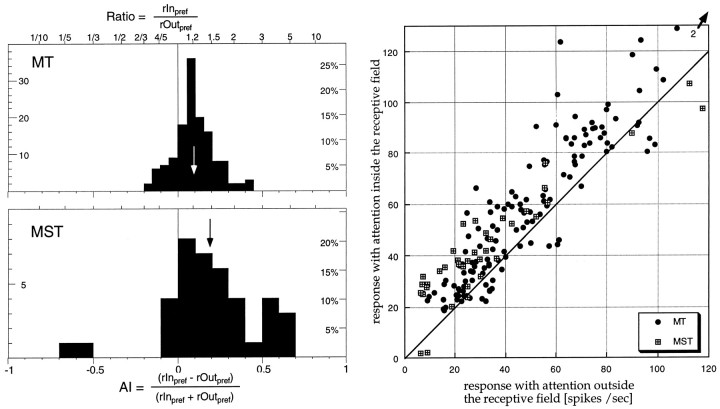
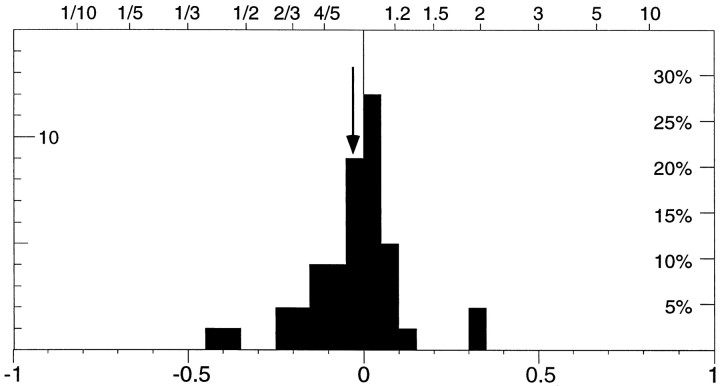
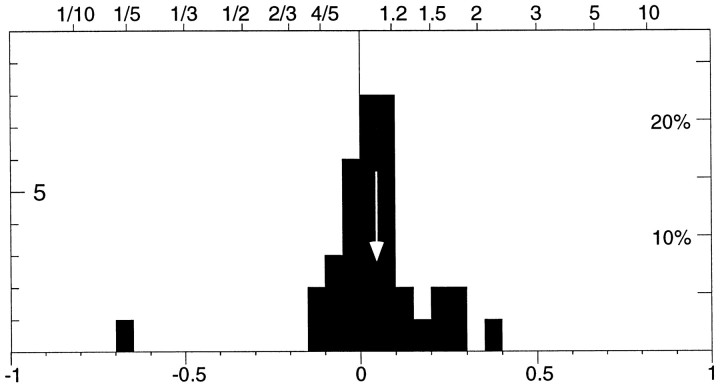
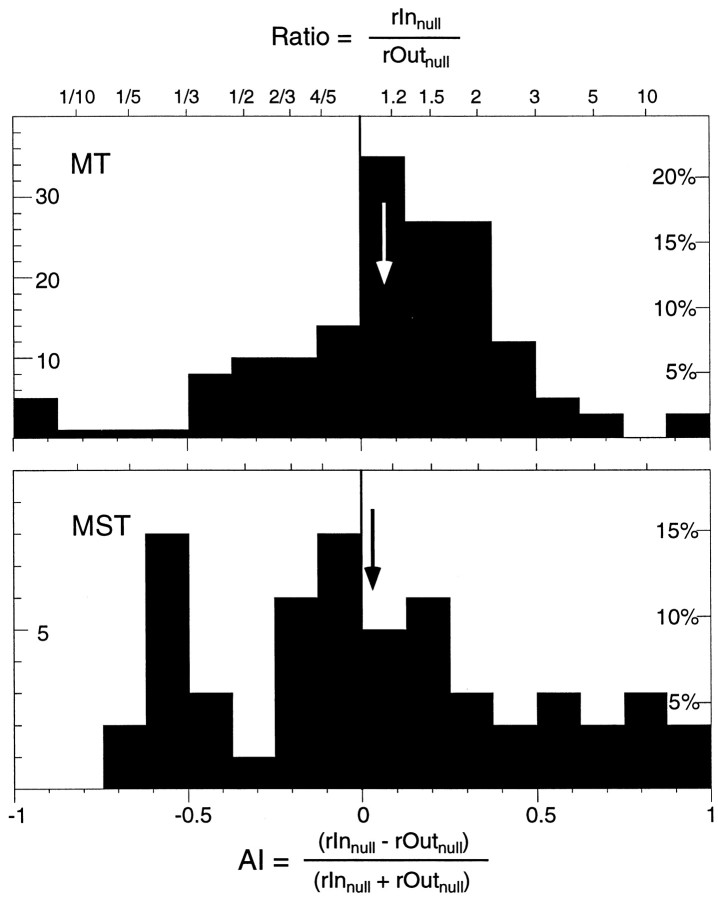
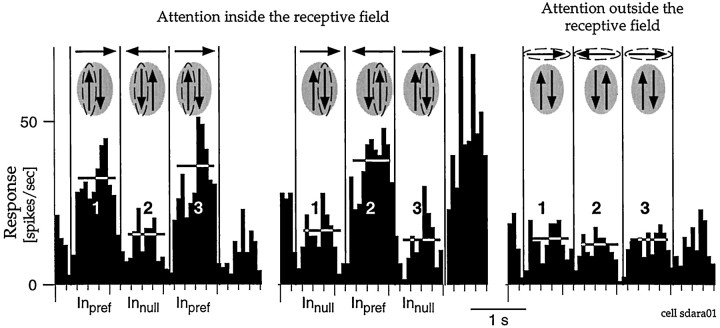
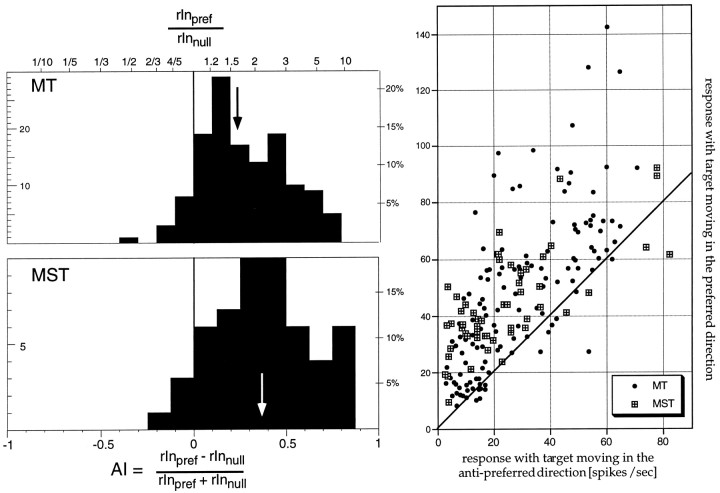
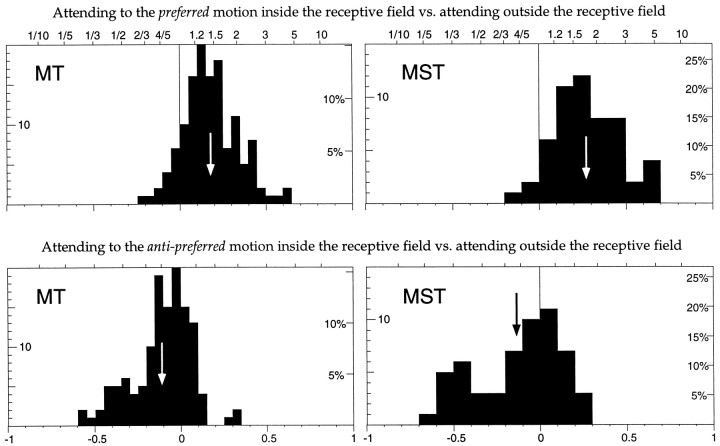
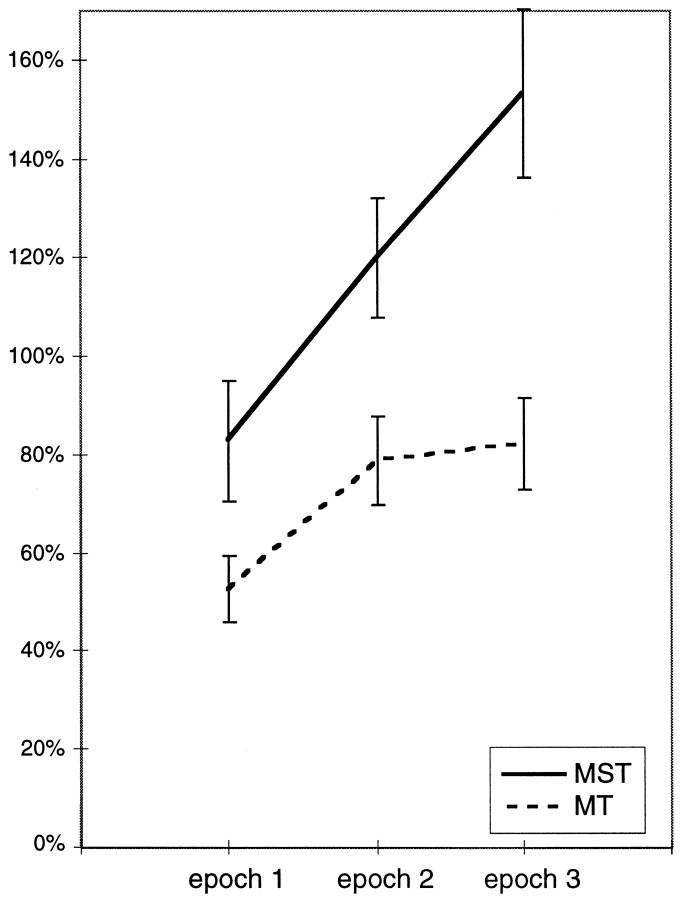
The visual system is continually inundated with information received by the eyes. Only a fraction of this information appears to reach visual awareness. This process of selection is one of the functions ascribed to visual attention. Although many studies have investigated the role of attention in shaping neuronal representations in cortical areas, few have focused on attentional modulation of neuronal signals related to visual motion. We recorded from 89 direction-selective neurons in middle temporal (MT) and medial superior temporal (MST) visual cortical areas of two macaque monkeys using identical sensory stimulation under various attentional conditions. Neural responses in both areas were greatly influenced by attention. When attention was directed to a stimulus inside the receptive field of a neuron, responses in MT and MST were enhanced an average of 20 and 40% compared with a condition in which attention was directed outside the receptive field. Even stronger average enhancements (70% in MT and 100% in MST) were observed when attention was switched from a stimulus moving in the nonpreferred direction inside the receptive field to another stimulus in the receptive field that was moving in the preferred direction. These findings show that attention modulates motion processing from stages early in the dorsal visual pathway by selectively enhancing the representation of attended stimuli and simultaneously reducing the influence of unattended stimuli.


Figures

Fig. 1.
Fig. 1.
Stimulus conditions used in experiment 1. The two middle panels show the difference between the two experimental conditions used in this experiment. The left panel shows the screen at the beginning of the trial, themiddle panels show the layout of the screen until the monkey initiates a trial by depressing the lever, and the right panel shows the period of data collection, during which the dots moved back and forth across the screen. All data presented here come from the movement period, i.e., when the two experimental conditions had identical sensory stimulation. The dashed line is the circumference of the classical receptive field (RF), plotted by hand using a moving dot or light bar while the animal fixated a small spot. The cross(FC) is the spot the animal had to fixate for the duration of each trial. In experiment 1, one dot traveled back and forth through the receptive field along the preferred and anti-preferred directions of the cell while the other dot moved outside the receptive field. Although this example shows a parallel movement of the two dots, the relative direction of motion between them varied from cell to cell.
Fig. 2.
Fig. 2.
Stimulus conditions used in experiment 2. As in Figure 1, the panels from left to rightshow the progression from the screen appearance before fixation, before initiating a trial by depressing the lever, and during the actual trial. Experiment 2 differed from experiment 1 in that two dots were presented inside the receptive field, moving in parallel but out of phase (mean track separation: 1.9° for MT cells and 2.6° for MST cells). Because each of the three dots could be designated the target during the cue presentation, there are now three different trial types, although the display differed only during the cue presentation. In both of the two bottom panels for cue presentation, attention is inside the receptive field. As in experiment 1, the direction of motion of the dot outside the receptive field bore no consistent relationship to the direction of the dot inside the receptive field. It was generally chosen so that it would remain in the other visual hemifield and not leave the display screen. The whiteand black arrows are intended to illustrate the two alternating movement directions of the dots.
Fig. 3.
Fig. 3.
Parasagittal myelin-stained section of the superior temporal sulcus. Dorsal is up, and anterior is to the left. The borders of MT were assigned based on its distinctive myelination. Small triangles mark the range of uncertainty in locating the borders of MT in this section.Arrows mark two electrolytic lesions that were made with a recording microelectrode.
Fig. 4.
Fig. 4.
Effects of attention on responses in experiment 1. Both histograms show the responses from one neuron in MST, while the animal attended either to the dot in the receptive field (left panel) or to the one outside the receptive field (right panel). Sketchesabove each histogram schematize the stimulus motions in the four trial epochs, with the attended stimulus (the target) circledwith the dashed line and the shaded areasymbolizing the receptive field. The preferred direction is represented by upward motion. Vertical lines in the histograms mark the times when the dots reversed direction. The activity to theleft of the first reversal is the response of the cell to preferred direction motion in the receptive field from the starting point of the dot to the first reversal. Horizontal linesmark the periods in which data were analyzed and the average firing rate for those periods. Because the target changed after a random time in-terval, and only data before any speed change are averaged into this histogram, the number of trials contributing to the bins decreases with time. For a number of cells we also or only collected data in a condition with reversed direction order, i.e., where the first and third epoch contained preferred direction motion. For this cell, the response when attention was directed to the receptive field stimulus moving in the preferred direction (Inpref) was ∼20% larger in the second epoch and ∼35% larger in the fourth epoch compared to the identical stimulus conditions when attention was directed to the stimulus outside the receptive field (Outpref epochs 2 and 4).
Fig. 5.
Fig. 5.
Histogram of the strength of attentional modulation for all neurons and for each preferred direction motion epoch. The top histogram shows the data for 137 preferred motion epochs from 66 MT cells (mean of the distribution: 0.10, marked by the arrow), the bottomhistogram shows the indexes based on 39 epochs from 21 MST cells (mean, 0.19). Binning is based on the attentional index (bottom axis). The top edge of the histogram frames shows the corresponding values when taking the ratio of the responses in the two conditions. The scatterplot on the rightplots the individual mean firing rates used to compute the index values in the histograms on the left. Thediagonal is the line connecting points where the responses in the two conditions are identical, i.e., points above the line signify cells whose responses were larger when the stimulus inside the receptive field was the target.
Fig. 6.
Fig. 6.
Histogram of the relative activity between epochs of control conditions in which the monkey tracked the fixation point in phase with the dot moving in the preferred direction inside the receptive field, and periods when the monkey tracked the fixation point in anti-phase to that motion. The distribution is based on 43 cells (31 MT, 10 MST, 2 either MT or MST) and is not significantly shifted from 0 (mean, −0.03; marked by the arrow).
Fig. 7.
Fig. 7.
Histogram of the relative activity between trial epochs in which the animal was just required to maintain fixation and those trials epochs in which the animal was required to respond to a speed change of the dot moving inside the receptive field. The distribution is based on 36 cells (30 MT, 5 MST, 1 either MT or MST) and is significantly shifted to the right of 0 (mean, 0.04; marked by the arrow), indicating that responses were ∼9% higher when attending inside the receptive field than during the fixation-only epochs.
Fig. 8.
Fig. 8.
Histograms of the attentional modulation when the dot inside the receptive field was moving in the anti-preferred direction and the animal was either attending inside (Innull) or outside (Innull) the receptive field. The top histogram shows the distribution of 162 indices from 66 MT cells. It is shifted significantly to the right (mean, 0.07; i.e., a 15% enhancement, marked by the arrow), indicating a larger response when the animal was attending inside the receptive field. Thebottom histogram plots the 54 indices from 21 MST cells, showing no significant shift.
Fig. 9.
Fig. 9.
Responses with two stimuli inside the receptive field. The histograms show the responses of an MST neuron during experiment 2. The sketches above the histograms represent the movement of the three dots presented, and thedashed ellipses denote the target stimulus in the respective trials. The left two histograms show responses while the animal attended to either the left or the right dot in the receptive field, and the right histogram plots responses when the animal attended to the dot outside the receptive field. The direction of the dot outside the receptive field relative to the axis of motion inside the receptive field varied from cell to cell. The vertical lines in each histogram mark the reversals of the directions of the dots. When one of the receptive field stimuli was the attended dot, the response of the neuron was strong whenever that dot moved in the preferred direction (epochs marked Inpref). The activity was relatively unmodulated when the animal was attending to the dot outside the receptive field (right histogram). For this cell, the response when directing attention to the receptive field stimulus moving in the preferred direction (Inpref) was ∼94% larger in the first epoch, ∼135% larger in the second epoch, and ∼164% larger in the third epoch compared to the identical stimulus conditions when attention was directed to the stimulus moving in the anti-preferred direction inside the receptive field (Innull). These values are typical for MST cells (see also Figs. 10, 12).
Fig. 10.
Fig. 10.
Histogram of the attention index in experiment 2 (labels as in Fig. 5) for all epochs. The top histogram shows the distribution of indices based on 134 epochs from 46 MT cells, the bottom histogram the distribution of 53 indices from 16 MST cells. Both distributions are significantly shifted to the right (mean for MT cells, 0.24; i.e., an ∼60% higher response when attention was directed toward the preferred motion stimulus; mean for MST cells, 0.37, i.e., an ∼100% stronger response). The scatter plot on the right plots the actual firing rates when attention was directed toward the anti-preferred motion on thex-axis versus the responses when attention was on the preferred direction on the y-axis. Thediagonal is the line that connects all points where the responses in the two conditions are identical. Points above this line signify stronger responses when the target was the dot moving in the preferred direction.
Fig. 11.
Fig. 11.
The same two attentional conditions that were compared in Figure 10 are here compared against a neutral condition where both stimuli inside the receptive field are behaviorally irrelevant. The top panels show histograms of the change in responses seen when the response while the animal attended to the dot moving in the preferred direction (rInpref) is compared to the response when the animal was presented with the exact same stimulus condition but was instructed to attend to the dot outside the receptive field (Fig. 9, right panel). Both distributions are shifted significantly to the right[MT, mean 0.18 (∼44% enhancement); MST, mean 0.27 (∼74% enhancement)], indicating a larger response when attention is directed onto the preferred motion stimulus inside the receptive field. Thebottom panels show histograms of the change in responses seen when the response while the animal attended to the dot moving in the anti-preferred direction (rInnull) is compared to the response when the animal was presented with the exact same stimulus condition but was instructed to attend to the dot outside the receptive field. Both distributions are shifted significantly to the left [MT, mean −0.11 (∼10% suppression); MST, mean −0.13 (∼12% suppression)], indicating a reduced response when attention is directed onto the anti-preferred motion stimulus inside the receptive field.
Fig. 12.
Fig. 12.
Mean attentional enhancement as a function of trial epoch, i.e., time for MT and MST cells in experiment 2. Included are data from the 33 MT cells and 16 MST cells for which the data span three movement epochs (such as the MST neuron shown in Fig. 9). The duration of the epochs varied between cells (range, ∼700–1200 msec). The first complete epoch began with the first movement reversal, i.e., 150–350 msec into the motion (see Materials and Methods for details). Error bars indicate SEM.
Fig. 13.
Fig. 13.
A–D, Spike histograms from one MST cell with recordings from experiment 2. The top panels (A, B) show correct trials with the animal attending either to the right or left dot inside the receptive field. The middle panels (C, D) show responses on trials in which the animal released the lever prematurely within a few hundred milliseconds after a speed change in the distractor. These trials were not rewarded and where normally not included into the analysis. This example shows that the response in C is very similar to the one inB, and the one in D is very similar to the one in A, indicating that the animal was attending to the distractor. E, F, The index histograms show the relative activities in corresponding epochs for error trials (like the ones in C and D) and correctly completed trials (like the ones in A and B) whenever at least one error trial was recorded. This was the case for 57 cells and for 122 epochs when the target was moving in the anti-preferred direction and 121 epochs when the target was moving in the preferred direction. Negative values indicate responses that are larger in error trials. The left histogram compares activity in epochs in which the designated target was moving in the anti-preferred direction (such as epoch 2 in panels Aand C and epochs 1 and 3 in panels B andD). The right histogram compares activity in epochs in which the designated target was moving in the preferred direction (such as epochs 1 and 3 in panels A andC and epoch 2 in panels B andD).

Similar articles

Cited by

References

    1. Andersen RA, Graziano MSA, Snowden R. Translational invariance and attentional modulation of MST cells. Soc Neurosci Abstr. 1990;16:7.
    1. Assad JA, Maunsell JHR. Neuronal correlates of inferred motion in primate posterior parietal cortex. Nature. 1994;373:518–521. - PubMed
    1. Beauchamp MS, Cox RW, DeYoe EA. Graded effects of spatial and featural attention on human area MT and associated motion processing areas. J Neurophysiol. 1997;78:516–520. - PubMed
    1. Britten KH. Spatial interactions within monkey middle temporal (MT) receptive fields. Soc Neurosci Abstr. 1995;21:663.
    1. Britten KH, Shadlen MN, Newsome WT, Movshon JA. The analysis of visual motion: a comparison of neuronal and psychophysical performance. J Neurosci. 1992;12:4745–4765. - PMC - PubMed

Publication types

LinkOut - more resources