. 1999 Aug 15;13(16):2072-86.
doi: 10.1101/gad.13.16.2072.

Indian hedgehog signaling regulates proliferation and differentiation of chondrocytes and is essential for bone formation

Affiliations

Indian hedgehog signaling regulates proliferation and differentiation of chondrocytes and is essential for bone formation

B St-Jacques et al. Genes Dev. .

Erratum in

  • Genes Dev 1999 Oct 1;13(19):2617

Abstract

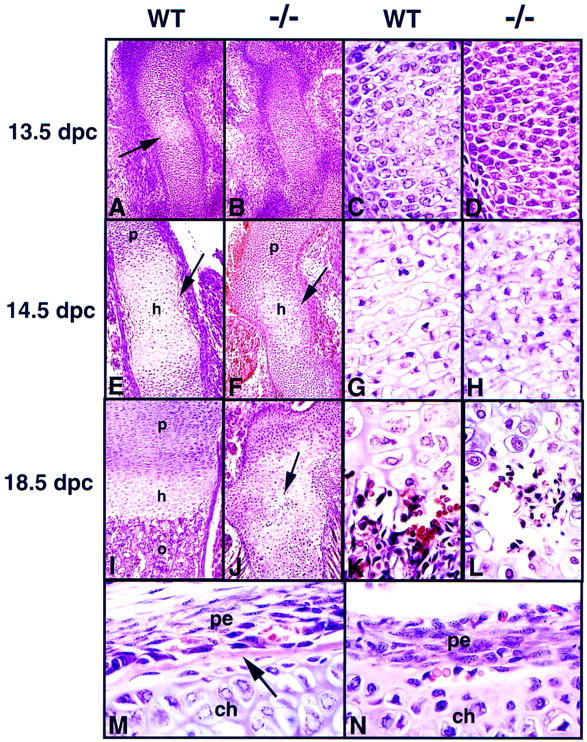
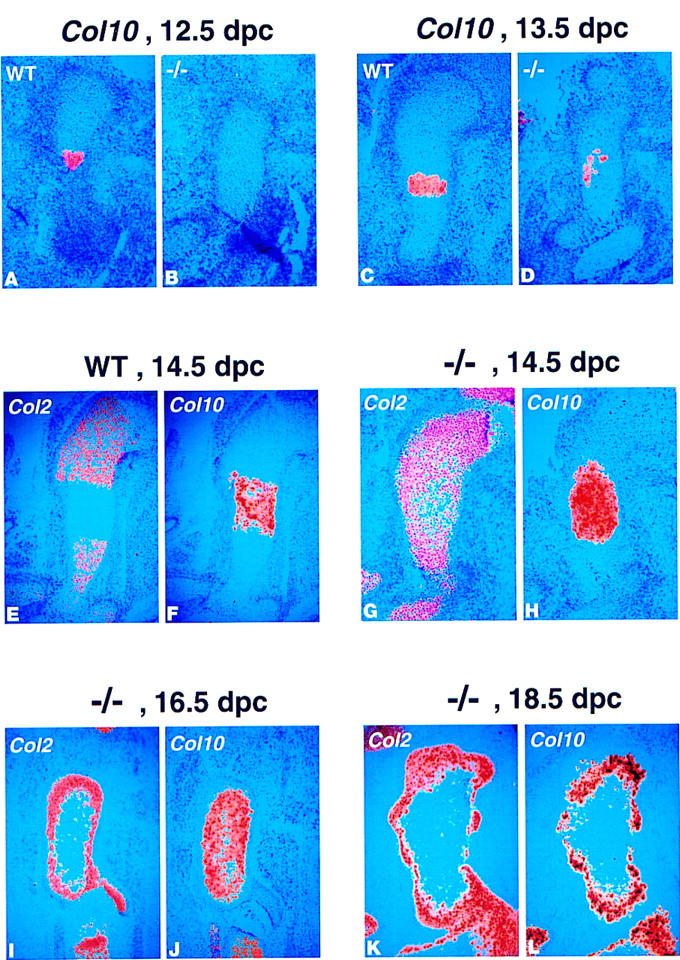
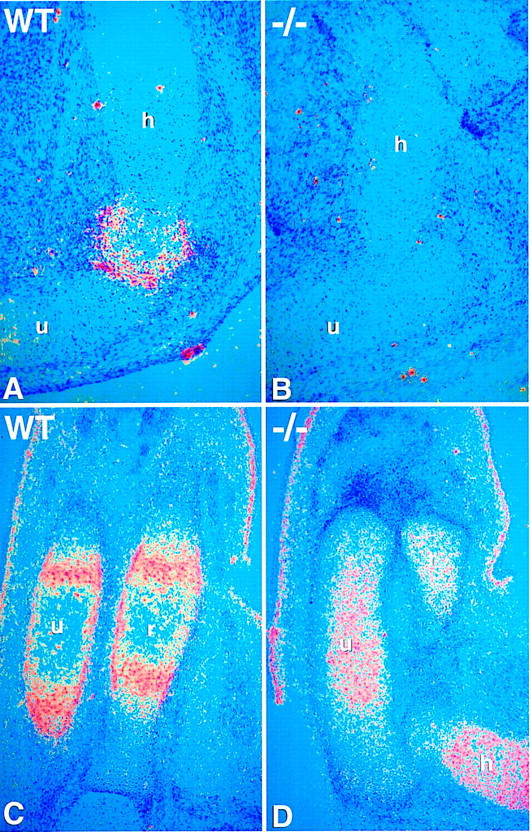
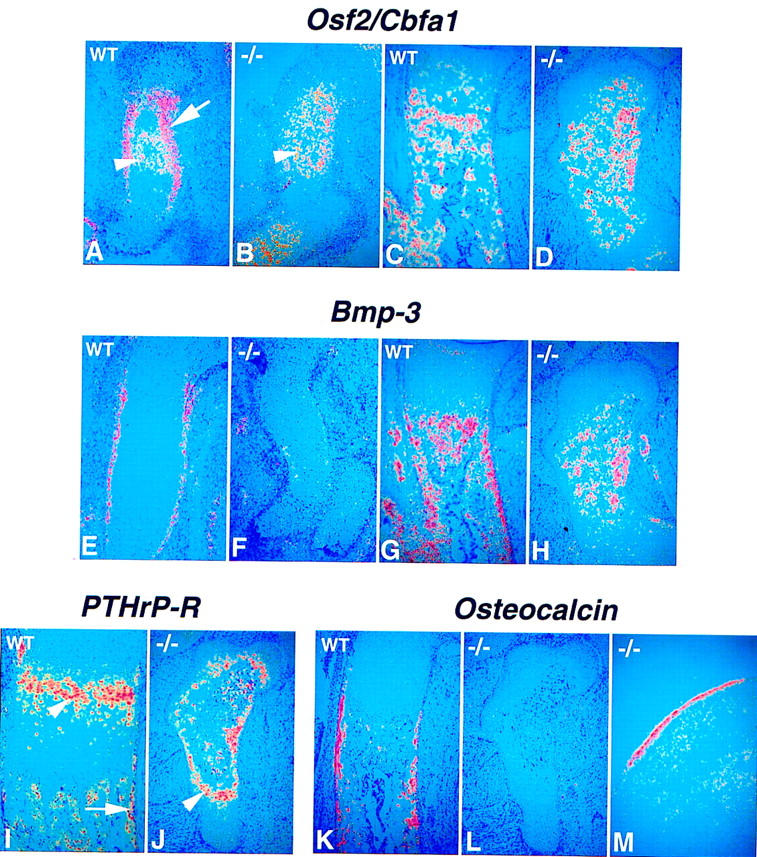
The mechanisms that control cell proliferation and cell differentiation during morphogenesis of the endochondral skeleton of vertebrates are poorly understood. Indian hedgehog (Ihh) signaling from prehypertrophic chondrocytes has been implicated in the control of chondrocyte maturation by way of feedback control of a second secreted factor parathyroid hormone-related peptide (PTHrP) at the articular surfaces. Analysis of an Ihh null mutant suggests a more extensive role for Ihh in skeletal development. Mutants display markedly reduced chondrocyte proliferation, maturation of chondrocytes at inappropriate position, and a failure of osteoblast development in endochondral bones. Together, the results suggest a model in which Ihh coordinates diverse aspects of skeletal morphogenesis through PTHrP-dependent and independent processes.


Figures

Figure 1
Figure 1
Generation of Ihh null mice by gene targeting. (A) Diagram of the Ihh locus, the targeting vector, and the mutant allele. E1, E2, and E3 indicate exons 1 to 3 of the Ihh gene. Black boxes correspond to the sequence encoding the 19-kD signaling peptide. The location of the fragments used as probes in Southern blotting are shown, as well as the sizes of the NcoI and XhoI fragments detected for wild-type and targeted alleles. (B) Southern blot analysis of genomic DNA. DNA from 16.5-dpc embryos was digested with NcoI and hybridized with the KpnI–HindIII 5′probe shown in A. The resulting 7.6- and 8.4-kb bands correspond to the wild-type and mutated alleles, respectively.
Figure 2
Figure 2
Phenotype of Ihh mutant mice. (A,C,E) Wild-type animals (Ihh +/+); (B,D,F) mutant animals (Ihh −/−). (A, B) 13.5-dpc embryos. The forelimb in the mutant embryo is significantly shorter than in the wildtype (white arrows). (C,D) Gross appearance of newborns. Note the rounded skull, shortened face and tail, and the severe dwarfism of the limbs in the mutant. (E,F) Skeletons of newborns stained with Alcian blue (cartilage) and Alizarin red (calcified tissue). General patterning of the skeleton is normal but all elements of the axial and appendicular skeletons are significantly reduced in size in the mutant.
Figure 3
Figure 3
Development of the forelimb skeleton. (A,C,E,G,I) Wild-type forelimbs; (B,D,F,H,J,K) Ihh −/− forelimbs. In A and B forelimbs were stained with Alcian blue. In C–K forelimbs were stained with Alcian blue and Alizarin red. (A,B) 12.5-dpc limbs. Note that the initial cartilage elements form normally in the mutant. (C,D) 14.5-dpc limbs. (E,F) 16.5-dpc limbs. (G,H) 18.5-dpc limbs. An obvious difference in length of the long bones visible at 14.5-dpc becomes progressively more severe, indicating a failure of the growth process in the mutant. (I) Higher magnification of the wild-type humerus shown in C. Arrow indicates formation of a bone collar. (J) Higher magnification of the Ihh −/− humerus shown in F. Arrow indicates calcification in the center of the cartilage only. (K) 18.5-dpc Ihh−/− limb at higher magnification. Arrowheads indicate areas of ectopic calcification. Arrows indicate incomplete joint formation. (A–D) Bar 0.5 mm; (E–H,K) bar 1 mm.
Figure 4
Figure 4
Reduced chondrocyte proliferation and absence of Ihh and Ptc-1 expression in embryonic long bones in the Ihh mutant. (A,B) BrdU labeling in the humerus of wild-type (A) and Ihh −/− (B) embryos at 14.5 dpc. BrdU-positive nuclei are stained black. All nuclei are counter stained with toluidine blue. The black bar annotated P indicates the extent of the zone of proliferation. (C) BrdU incorporation calculated as percentage of BrdU-positive nuclei in the proliferation zone at different developmental stages. Bars represent means + s.d.. (Open bars) wildtype, (solid bars) Ihh−/−. (*) P < 0.01; (**) P < 0.005 (Student’s t-test). (D–K) 35-S in situ hybridization for Ihh and Ptc-1 on longitudinal sections through wild-type and Ihh −/− humerus at different stages of development. (D, F, H,J) Ihh expression. (E, G, I, K) Ptc-1 expression. (D,E) Wild-type humerus at 12.5-dpc. Ihh is expressed by the chondrocytes in the center of the cartilage (D), Ptc-1 is expressed in a much broader domain (E). (F,G) Ihh −/− humerus at 12.5 dpc. Note the absence of Ihh (F) and Ptc-1 (G) expression in the mutant cartilage (the hybridization signal seen in G is not associated with the cartilage and probably represents Ptc-1 expression in the developing nerves). (H,I) Wild-type humerus at 13.5 dpc. Although Ihh expression is starting to get down-regulated in the more mature chondrocytes in the center of the cartilage (H), Ptc-1 is expressed at a high level in the perichondrium and at a lower level in proliferating chondrocytes (arrow in I). (J,K) Wild-type humerus at 18.5 dpc. Ihh expression (J) is restricted to the prehypertrophic chondrocytes; Ptc-1 expression (K) is detected in the proliferating chondrocytes (arrow) and in a new domain at the chondro-osseus junction (arrowhead).
Figure 5
Figure 5
Histological analysis of endochondral ossification in the Ihh mutant. (A, C, E, G, I, K, M) Hematoxylin/eosin-stained longitudinal sections through wild-type humerus. (B, D, F, H, J, L, N) Sections through Ihh−/− humerus. In all the panels except M and N, proximal is at the top, distal at the bottom. (A,B) 13.5 dpc. The arrow in A points to chondrocytes undergoing hypertrophy in the wild-type humerus. (C,D) Higher magnification of chondrocytes in the center of the bones shown in A and B. (E,F) 14.5 dpc. The arrow in E indicates newly formed cortical bone in the wild-type humerus. The arrow in F indicates less mature chondrocytes surrounding the population of hypertrophic cells. (G,H) Higher magnification of chondrocytes in the center of the bones shown in E and F. (I,J) 18.5 dpc. The arrow in J indicates a newly formed site of vascular invasion and degradation of the cartilage. (K,L) Higher magnification of cells at the chondro-osseous junction or the newly formed site of vascular invasion shown in I and J, respectively. (M) Longitudinal section through a wild-type humerus at 18.5 dpc showing the periosteum and the newly formed cortical bone (arrow) adjacent to the zone of hypertrophic chondrocytes. (N) Section through a Ihh −/− humerus at 18.5 dpc showing the abnormal histology of the perichondrium and the absence of cortical bone formation even in vascularized areas. (ch) chondrocytes; (h) zone of hypertrophic chondrocytes; (o) zone of ossification; (p) zone of proliferating chondrocytes; (pe) perichondrium/periosteum.
Figure 6
Figure 6
Abnormal patterns of expression of collagen type II and type X, indicate a delay in maturation of the chondrocytes in the Ihh −/− long bones. (A–L) 35-S in situ hybridization for collagen type II (Col2) and type X (Col10) on longitudinal sections through wild-type and Ihh −/− long bones at different stages of development. (A,B) Col10 expression in wild-type (A) and Ihh −/− (B) humerus at 12.5 dpc. No Col10 expression was detected at this stage in the mutant. (C,D) Col10 expression in wild-type (C) and Ihh −/− (D) humerus at 13.5 dpc. Only patchy Col10 expression was visible in the mutant. (E,F) Col2 (E) and Col10 (F) expression in wild-type humerus at 14.5 dpc. The domains of expression of Col2 (less mature chondrocytes) and Col10 (hypertrophic chondrocytes) are almost nonoverlapping at this stage. (G,H) Col2 (G) and Col10 (H) expression in Ihh −/− humerus at 14.5 dpc. In the mutant there is still a very broad overlap in Col2 and Col10 expressions at this stage. (I,J) Col2 (I) and Col10 (J) expression in Ihh −/− fibula at 16.5 dpc. At this stage, the more mature chondrocytes in the center of the cartilage express only Col10. A less mature population expressing only Col2 surrounds these cells. (K,L) Col2 (K) and Col10 (L) expression in Ihh −/− humerus at 18.5 dpc.
Figure 7
Figure 7
Absence of PTHrP expression in the Ihh −/− mutant. (A–D) 35S in situ hybridization for PTHrP and PTHrP-R on longitudinal sections through wild-type and Ihh −/− forelimb bones at 14.5 dpc. (A,B) PTHrP expression in articular perichondrium of wild-type (A) and Ihh −/− (B) humerus. No PTHrP expression is detected in the mutant. (C,D) PTHrP-R expression in wild-type (C) and Ihh −/− (D) radius and ulna. Note that in the wild-type, PTHrP-R expression is detected in maturing chondrocytes and in the perichondrium/periosteum. There is PTHrP-R expression in the mutant chondrocytes but not in the perichondrium. (h) Humerus; (u) ulna; (r) radius.
Figure 8
Figure 8
Absence of endochondral bone formation before birth in the Ihh −/− mutant. (A–L) 35-S in situ hybridization for perichondrial markers on longitudinal sections through wild-type and Ihh −/− humerus at different stages of development. (A, C, E, G, I, K) Wild-type bones. (B, D, F, H, J, L, M) Ihh −/− bones. (A–D) Osf-2/Cbfa1 expression. (A) Wild-type at 13.5 dpc. Expression is detected in the perichondrium (arrow) and some mature chondrocytes (arrowhead). (B) Ihh −/− at 14.5 dpc. Osf-2/Cbfa1 expression is detected only in the more mature chondrocytes at the center of the humerus (arrowhead). (C,D) 18.5 dpc. (E–H) Bmp3 expression. (E, F) 14.5 dpc. (G, H) 18.5 dpc. (I,J) PTHrP-R expression at 18.5 dpc. Arrow in I indicates expression in the periosteum. Arrowhead in I and J indicates expression in chondrocytes. (K–M) osteocalcin expression. (K, L) 18.5 dpc. (M) Coronal section through parietal bone of the skull in a mutant embryo at 18.5 dpc showing osteocalcin expression in the intramembranous bone.

References

    1. Akiyama H, Shigeno C, Iyama K, Ito H, Hiraki Y, Konoshi J, Nakamura T. Indian hedgehog in the late-phase differentiation in mouse chondrogenic EC cells, ATDC5: Upregulation of type X collagen and osteoprotegerin ligand mRNAs. Biochem Biophys Res Commun. 1999;257:814–820. - PubMed
    1. Amizuka N, Warshawsky H, Henderson J E, Goltzman D, Karaplis A C. Parathyroid hormone-related peptide-depleted mice show abnormal epiphyseal cartilage development and altered endochondral bone formation. J Cell Biol. 1994;126:1611–1623. - PMC - PubMed
    1. Amizuka N, Henderson J E, Hoshi K, Warshawsky H, Ozawa H, Goltzman D, Karaplis AC. Programmed cell death of chondrocytes and aberrant chondrogenesis in mice homozygous for parathyroid hormone-related peptide gene deletion. Endocrinology. 1996;137:5055–5067. - PubMed
    1. Apte SS, Seldin MF, Hayashi M, Olsen BR. Cloning of the human and mouse type X collagen genes and mapping of the mouse type X collagen gene to chromosome 10. Eur J Biochem. 1992;206:217–224. - PubMed
    1. Aubin J, Liu F. The osteoblast lineage. In: Bilezikian JP, Raisz LG, Rodan GA, editors. Principles of bone biology. New York, NY: Academic Press; 1996. pp. 51–67.

Publication types