

doi: 10.1073/pnas.96.18.9987.
Global climate change
Affiliations
- PMID: 10468545
- PMCID: PMC33725
- DOI: 10.1073/pnas.96.18.9987
Item in Clipboard
Global climate change
Proc Natl Acad Sci U S A.
.
Abstract
Most of the last 100,000 years or longer has been characterized by large, abrupt, regional-to-global climate changes. Agriculture and industry have developed during anomalously stable climatic conditions. New, high-resolution analyses of sediment cores using multiproxy and physically based transfer functions allow increasingly confident interpretation of these past changes as having been caused by "band jumps" between modes of operation of the climate system. Recurrence of such band jumps is possible and might be affected by human activities.
Figures
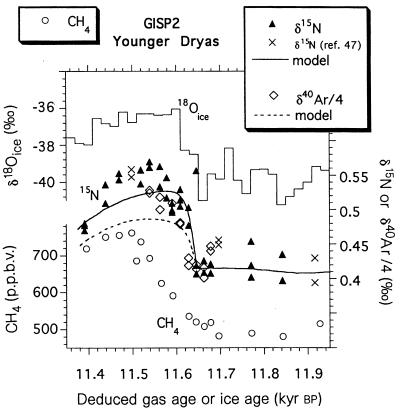
Gas-isotopic data from an ice core in central
Greenland covering the last deglaciation. Bubbles are formed ∼70 m
deep in the ice sheet, below a permeable layer of old snow called firn.
Gravitational fractionation in this layer causes the gases to be
isotopically slightly heavier than the free atmosphere. An abrupt
warming causes the surface snow to be warmer than the firn 70 m
down, and temperature gradients fractionate heavy isotopes to the cold
end. The gaseous signal diffuses to the trapping depth in a few years,
while heat flow reaches that depth in a century or so. The rise and
fall in the isotopic ratios of nitrogen (δ15N) and argon
(δ40Ar/4) record the rise and fall of the temperature
gradient caused by the abrupt surface warming followed by the gradual
warming at the depth of bubble trapping. The differential response of
these two indicators allows separation of contributions from
temperature gradients and gravitational fractionation, and indicates a
warming of ∼8°C in on the order of a decade. This agrees closely
with temperature change inferred from the isotopic composition of the
ice, shown by the upper curve. Significant rise in methane, produced in
global wetlands with a dominant role for the tropics, lags the warming
in Greenland by one sample (0–30 years), showing a widespread
geographic impact for the abrupt-change event. [Figure and legend
reproduced with permission from ref. (Copyright 1998, Macmillan
Publishers Ltd, http://www.nature.com/ )].
References
-
- Cuffey K M, Clow G D, Alley R B, Stuiver M, Waddington E D, Saltus R W. Science. 1995;270:455–458.
-
- Severinghaus J P, Sowers T, Brook E J, Alley R B, Bender M L. Nature (London) 1998;391:141–146.
-
- Charles C D, Lynch-Stieglitz J, Ninnemann U S, Fairbanks R G. Earth Planet Sci Lett. 1995;142:19–27.
-
- Alley R B, Clark P U. Annu Rev Earth Planet Sci. 1999;27:149–182.
-
- Stocker T F, Schmittner A. Nature (London) 1997;388:862–865.
MeSH terms
LinkOut - more resources
Full Text Sources
Miscellaneous
