. 1999 Aug 31;96(18):10104-8.
doi: 10.1073/pnas.96.18.10104.

Heightened sensitivity of a lattice of membrane receptors

Affiliations

Heightened sensitivity of a lattice of membrane receptors

T A Duke et al. Proc Natl Acad Sci U S A. .

Abstract

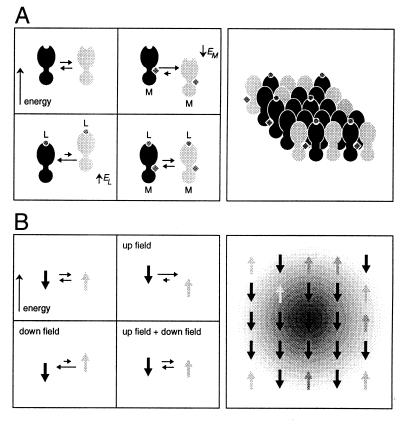
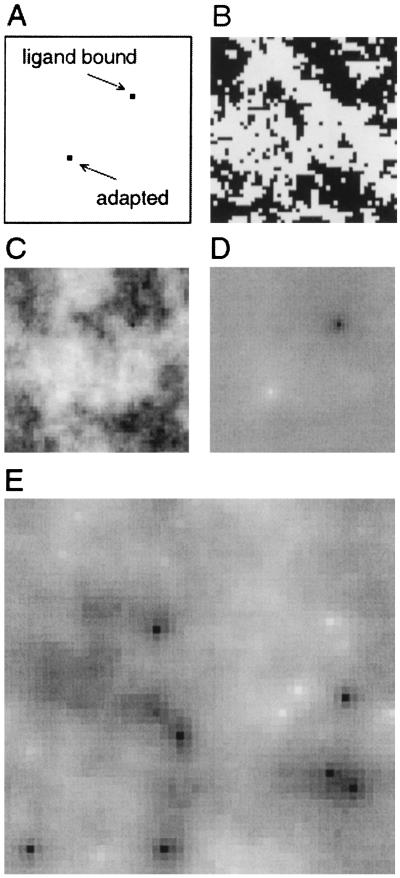
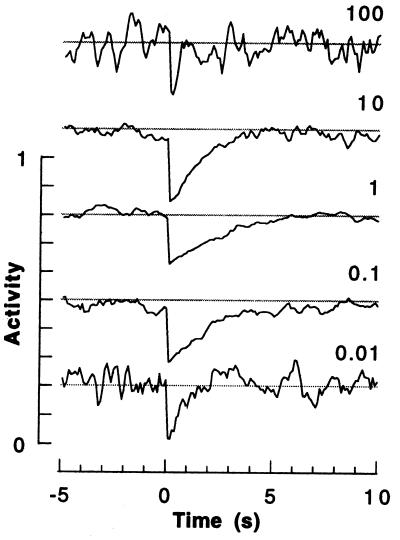
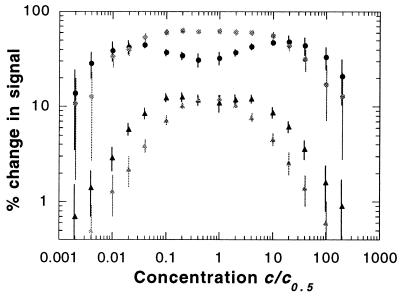
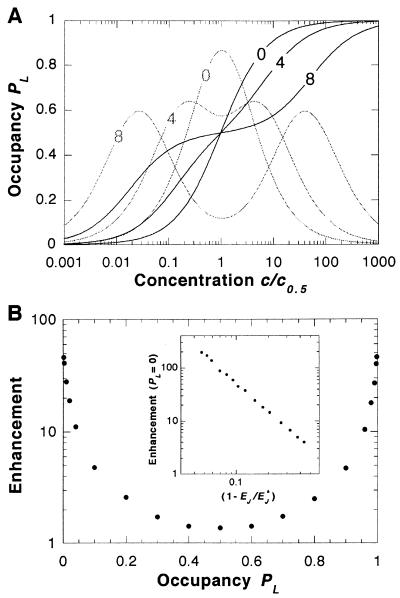
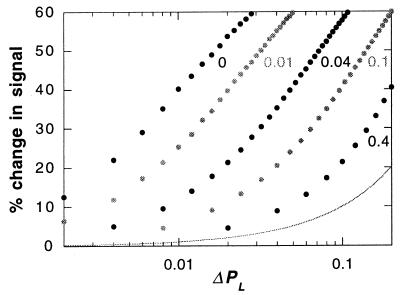
Receptor proteins in both eukaryotic and prokaryotic cells have been found to form two-dimensional clusters in the plasma membrane. In this study, we examine the proposition that such clusters might show coordinated responses because of the spread of conformational states from one receptor to its neighbors. A Monte Carlo simulation was developed in which receptors flipped in probabilistic fashion between an active and an inactive state. Conformational energies depended on (i) ligand binding, (ii) a chemical modification of the receptor conferring adaptation, and (iii) the activity of neighboring receptors. Rate constants were based on data from known biological receptors, especially the bacterial Tar receptor, and on theoretical constraints derived from an analogous Ising model. The simulated system showed a greatly enhanced sensitivity to external signals compared with a corresponding set of uncoupled receptors and was operational over a much wider range of ambient concentrations. These and other properties should make a lattice of conformationally coupled receptors ideally suited to act as a "nose" by which a cell can detect and respond to extracellular stimuli.


Figures

Figure 1
Figure 1
(A) Representation of the relative energies of the two conformational states of a receptor. The active (gray) and inactive (black) states of a virgin, isolated receptor have the same energy. Ligand binding (L) lowers the energy of the inactive state, and methylation (M) reduces the energy of the active state. When a receptor is part of a cluster, it also interacts with its four nearest neighbors; its energy is lowered by each adjacent receptor in the same conformational state and raised by each adjacent receptor in the alternative state. (B) This picture is analogous to the Ising model of a ferromagnet. An isolated magnetic spin is equally likely to point up (gray) or down (black). However, when a magnetic field is applied, the spin tends to point in the direction of the field (because it then has a lower energy). A ferromagnet is a lattice of coupled spins. In the Ising model, a cooperative interaction between adjacent spins lowers each of their energies when both spins have the same sign. Consequently, neighboring spins tend to align with one another. The magnetic properties of the array of spins depend on the magnitude of the coupling energy. Above a critical value, a high proportion of the spins all point in the same direction, and the array is ferromagnetic. Below the critical value, the array is paramagnetic (i.e., it is magnetized only when an external field is applied). Close to (but below) the critical point, the propagation of nearest-neighbor interactions causes one spin to influence other spins over a wide range (depicted by the shaded area). Then, a weak external field gives rise to a strong magnetization. In the receptor cluster, by analogy, a small change in the amount of bound ligand generates a big response.
Figure 2
Figure 2
Patterns of receptor activity in a coupled array. (A–D) In this series of simulations, ligand binding and adaptation were disabled so as to reveal the patterns caused by conformational spread alone. (A) One receptor in the 50 × 50 array was permanently assigned to the ligand-bound state, and another receptor was assigned to the adapted state. (B) The instantaneous pattern of active (white) and inactive (black) receptors is seen in an array after a period of equilibration. (C) Average levels of activity taken over 100 individual patterns, corresponding to 1 ms of biological time. Activities are represented by gray levels. (D) Receptor activities averaged over 10,000 patterns, equivalent to 0.1 s of biological time (which is a typical response time). The positions of the ligand-bound (black) and adapted (white) receptors are now evident. (E) Pattern of activity in an unconstrained array in which ligand binding and adaptation are allowed to proceed at their characteristic rates (ambient concentration c/c0.5 = 0.001). The pattern shown is an average over 1,000 time steps, equal to 10 ms of biological time. Discrete white patches correspond to the probable location of bound ligand molecules, and black patches correspond to the sites of adaptation.
Figure 3
Figure 3
Changes in array activity produced by a stepwise change in ligand concentration. Each individual trace shows how the activity of the lattice (measured by the average fraction of active receptors during a period of 10,000 time steps or 0.1 s) changes with time. The lattice was equilibrated with ligand at one concentration, and then its activity followed as this concentration was doubled (at time zero). The traces are labeled by the initial value of c/c0.5 and have been displaced vertically (the gray lines indicate the average activity of an adapted array, A0 = 0.5).
Figure 4
Figure 4
Response of a receptor array to a step change in concentration. The change in the signal, immediately after the concentration was doubled, is plotted as a function of the initial concentration c. The two pairs of data sets are for a coupled array of receptors with EJ/kT = 0.4 (circles) and the same number of independent receptors (triangles). Two values of ligand-binding energy are represented: EL/kT = 2 (gray) and EL/kT = 4 (black). The vertical bars indicate the typical noise in the signal when it is averaged over the response time (0.1 s).
Figure 5
Figure 5
(A) Fraction PL of receptors occupied by ligand molecules, as a function of the ambient concentration c, for an adapted cluster (black). These binding curves are plotted for EJ = 0 and different values of EL/kT, as marked. The functional form is PL = α(α + β)/2 + 2αβ + 1), where α = c/c0.5 and β = cosh(EL/2kT). For an uncoupled system, the response to a given fractional change in concentration is proportional to ΔPL and, thus, to the slope of the binding curve, giving a sensitivity indicated in gray (arbitrary units). (B) The enhancement of the response provided by coupling is defined as the average change in the signal generated by an adapted cluster, per additional occupied receptor, relative to the change in the signal produced by the same number of independent, adapted receptors. It is plotted as a function of the initial fraction of ligand-bound receptors PL. The curve depends only weakly on EL and is shown here for EL/kT = 4. (Inset) Variation of the enhancement (at zero occupancy) with the coupling energy EJ, showing power-law divergence as the critical coupling energy EJ* is approached.
Figure 6
Figure 6
Relative change in the signal as a function of the change in ligand occupancy ΔPL. The different data sets are for clusters that were initially adapted at different ambient concentrations and are labeled by the initial fraction of ligand-bound receptors PL. For comparison, the gray curve indicates the linear response of an uncoupled set of receptors (which is independent of the initial value of PL).

References

    1. Normann R A, Perlman I. J Physiol (London) 1979;286:491–507. - PMC - PubMed
    1. Dahlquist F W, Lovely P, Koshland D E., Jr Nat New Biol. 1972;236:120–123. - PubMed
    1. Mesibov R, Ordal G W, Adler J. J Gen Physiol. 1973;62:203–223. - PMC - PubMed
    1. Macnab R M, Koshland D E., Jr Proc Natl Acad Sci USA. 1972;69:2509–2512. - PMC - PubMed
    1. Koshland D E, Jr, Goldbetter A, Stock J B. Science. 1982;217:220–225. - PubMed

Publication types

LinkOut - more resources