. 1999 Aug 31;96(18):10123-8.
doi: 10.1073/pnas.96.18.10123.

Rapid characterization of green fluorescent protein fusion proteins on the molecular and cellular level by fluorescence correlation microscopy

Affiliations

Rapid characterization of green fluorescent protein fusion proteins on the molecular and cellular level by fluorescence correlation microscopy

R Brock et al. Proc Natl Acad Sci U S A. .

Abstract

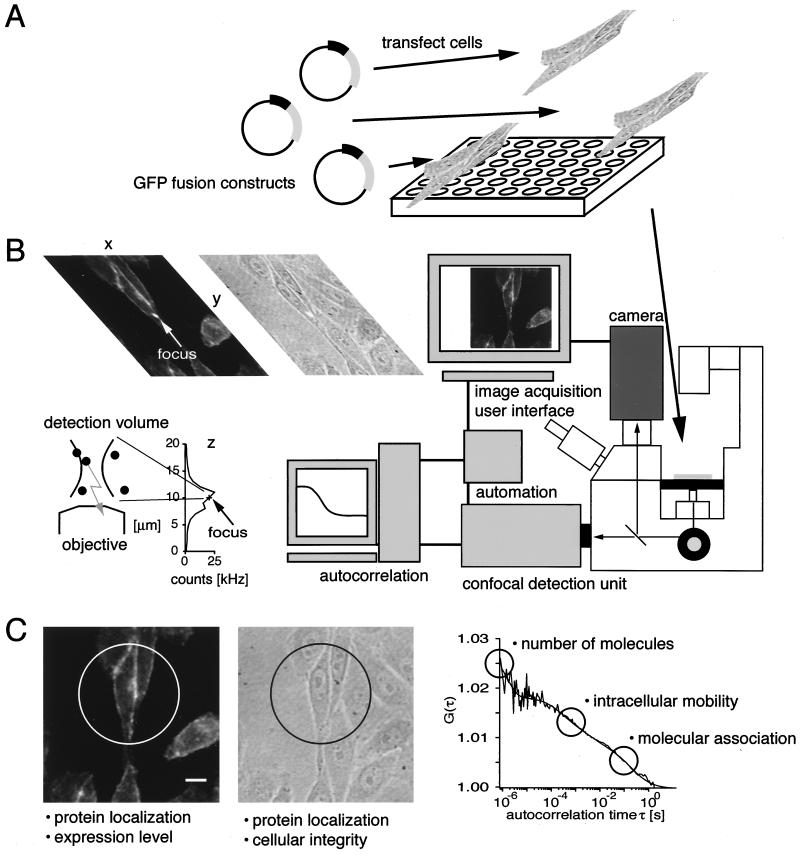
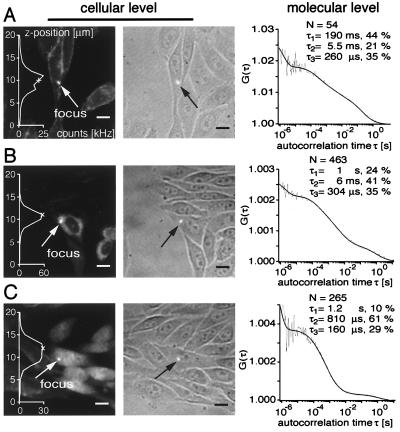
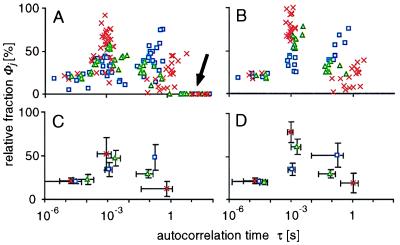
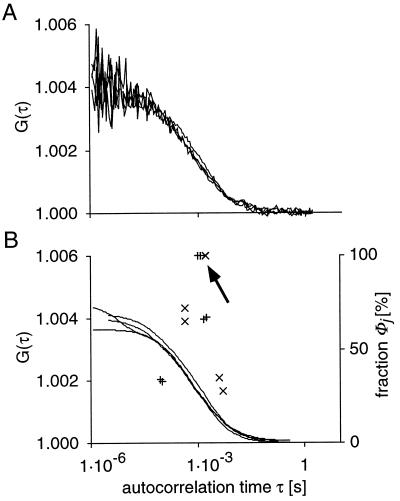
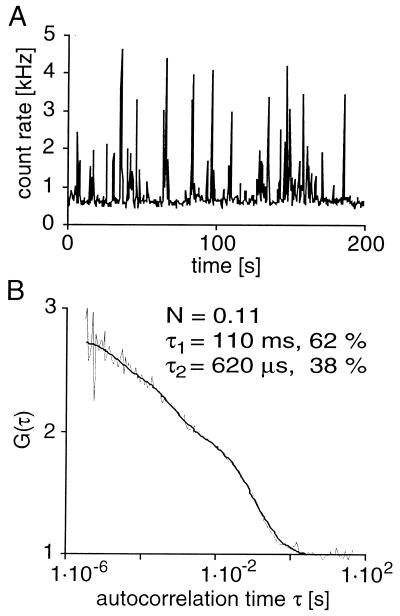
Fluorescence correlation microscopy (FCM) was applied to characterize fusion proteins of the green fluorescent protein (GFP) on the cellular as well as molecular level within seconds in an integrated instrument. FCM combines the inherent sensitivity and high spatial resolution of fluorescence correlation spectroscopy with fluorescence imaging and micropositioning, thereby providing a spectrum of molecular information in the cellular context. Signatures of characteristic parameters derived from the autocorrelation functions served to distinguish a GFP fusion protein of the epidermal growth factor receptor from GFP fluorescence in the endoplasmic reticulum and cytoplasm. Diffusion constants measured for free transiently expressed GFP reproduced values reported previously with other techniques. The accessible concentration range extends from millions to only a few thousand molecules per cell, with single molecule detectability in the femtoliter detection volume. The detailed molecular characterization offered by FCM is fully compatible with automation in sample identification and detection, offering new possibilities for highly integrated high-throughput screening.


Figures

Figure 1
Figure 1
Experimental protocol for FCM-based characterization of GFP fusion proteins. (A) Large numbers of GFP fusion constructs from recloned cDNAs or directly generated as cDNA-GFP fusion expression libraries are transfected into cells seeded in microtiter plates with bottoms of coverslip thickness, compatible for use in high-sensitivity measurements on inverted fluorescence microscopes. (B) The imaging modality of the FCM is used to identify single cells, document the distribution of the molecule, the homogeneity of the cell population, and the cell morphology. In confocal point measurements, the distribution of the molecule is determined along the optical z axis for precise positioning of the confocal measurement volume. Switching between illumination modes requires less than 1 sec and is free of optical readjustments. Subsequently, autocorrelations from the fluctuations of fluorescence in a confocal detection volume are measured, yielding information about the number of molecules and the presence and nature of distinct molecular states. The FCM integrates all these functionalities in an automated and programmable microscope environment. (C) Compilation of the information obtained from one FCM experiment: subcellular distribution of the fluorophore, morphology, and integrity of the cell, number of molecules in the cell, and the presence and nature of distinct molecular states inside the cell. In the case of the EGFR-GFP fusion protein presented here, both slow and fast diffusing components were present. Bar in C = 10 μm.
Figure 2
Figure 2
FCM-based characterization of GFP fusion proteins localized in (A) the plasma membrane, (B) the ER, and (C) the cytoplasm. (Left) Subcellular distribution in three dimensions. Profiles along the optical axis are superimposed on the fluorescence micrographs; (Center) bright-field images; (Right) autocorrelation functions fitted with three diffusional components, triplet term, and offset. For the later analysis weighted means were calculated for relaxation times differing by less than one order of magnitude (Fig. 3). Bar = 10 μm.
Figure 3
Figure 3
Statistical analysis of intracellular autocorrelation functions. (A and B) Scatter plots of the relative fraction φj vs. autocorrelation time τj for GFP proteins localized to the plasma membrane, the ER, and the cytoplasm. (C and D) Means and standard deviations calculated for the autocorrelation times and fractional contributions. Error bars exceeding the mean were omitted. (A and C) φj and τj as obtained from the fits; (B and D) φj and τj after binning the autocorrelation times within defined intervals (see text). The bleaching rate constants obtained from monoexponential fits to the count traces (not shown) are included on the abscissa of A highlighted by the arrow. The data represent 18 measurements from 3 cells (plasma membrane), 10 measurements from 2 cells (ER), and 21 measurements from 2 cells (cytoplasm).
Figure 4
Figure 4
Intracellular autocorrelation functions (A) and fits (B) of repeated 5-s measurements of transiently expressed free GFP in the cytoplasm. The ordinate to the right in B corresponds to the relative fractions φj of the components in the fits. A slow (×) or fast (+) process was obtained in addition to the major component; the arrow points at the weighted means. The average diffusion constant of cytoplasmic GFP was 1.7 ± 0.4 × 10⁻⁷ cm2/s, in good agreement with a value reported previously (29).
Figure 5
Figure 5
FCM at low levels of intracellular EGFR-GFP fusion proteins. (A) Fluorescence count trace. The peaks in the fluorescence count trace likely represent single EGFR-GFP molecules diffusing through the detection volume. (B) Autocorrelation function and parameters derived from a two-component fit. The number of molecules derived from the autocorrelation amplitude was corrected for the uncorrelated background fluorescence, derived from peak-free count intervals according to Eq. 1. The excitation intensity was 3.8 kW/cm2.

References

    1. Silverman L, Campbell R, Broach J R. Curr Opin Chem Biol. 1998;2:397–403. - PubMed
    1. Tsien R Y. Annu Rev Biochem. 1998;67:509–544. - PubMed
    1. Brock R, Jovin T M. Cell Mol Biol. 1998;44:847–856. - PubMed
    1. Brock, R. & Jovin, T. M. in Fluorescence Correlation Spectroscopy. Theory and Applications, eds. Elson, E. L. & Rigler, R. (Springer, Heidelberg), in press.
    1. Rigler R, Mets Ü, Widengren J, Kask P. Eur Biophys J. 1993;22:169–175.

Publication types

MeSH terms