. 1999 Aug 31;96(18):10261-6.
doi: 10.1073/pnas.96.18.10261.

Phylogenetic relationships among cetartiodactyls based on insertions of short and long interpersed elements: hippopotamuses are the closest extant relatives of whales

Affiliations

Phylogenetic relationships among cetartiodactyls based on insertions of short and long interpersed elements: hippopotamuses are the closest extant relatives of whales

M Nikaido et al. Proc Natl Acad Sci U S A. .

Abstract

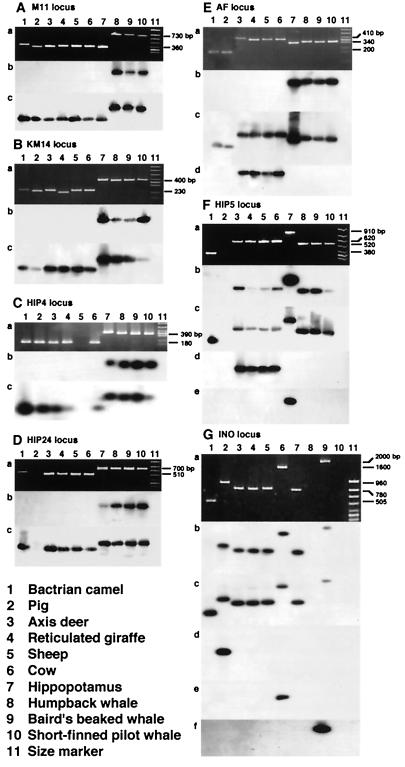
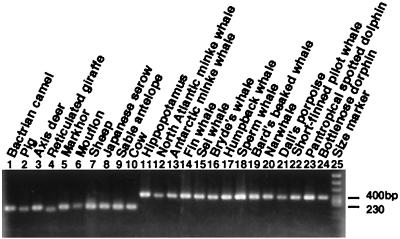
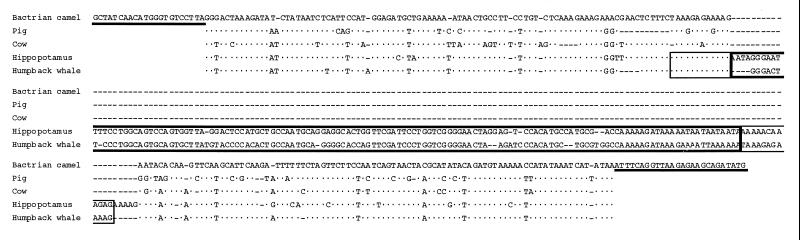
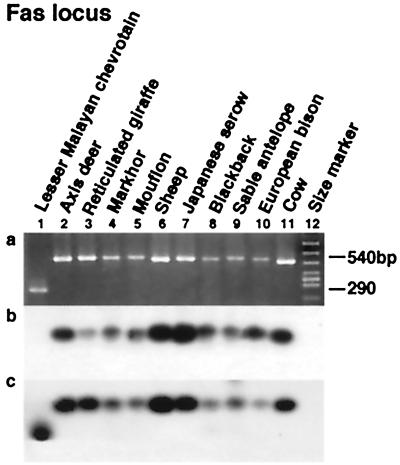
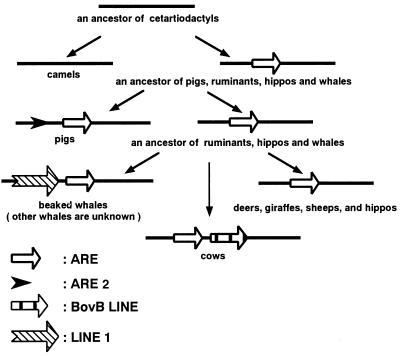
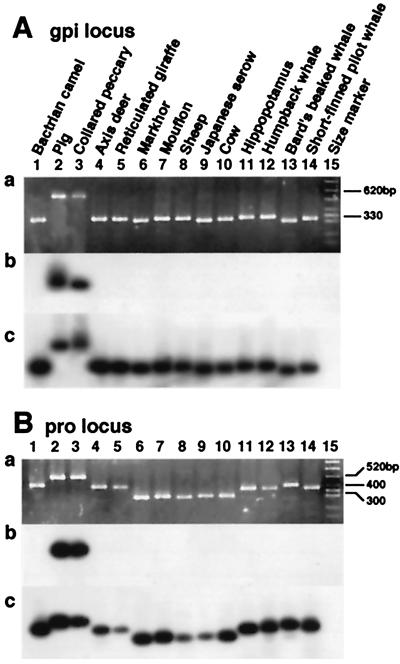
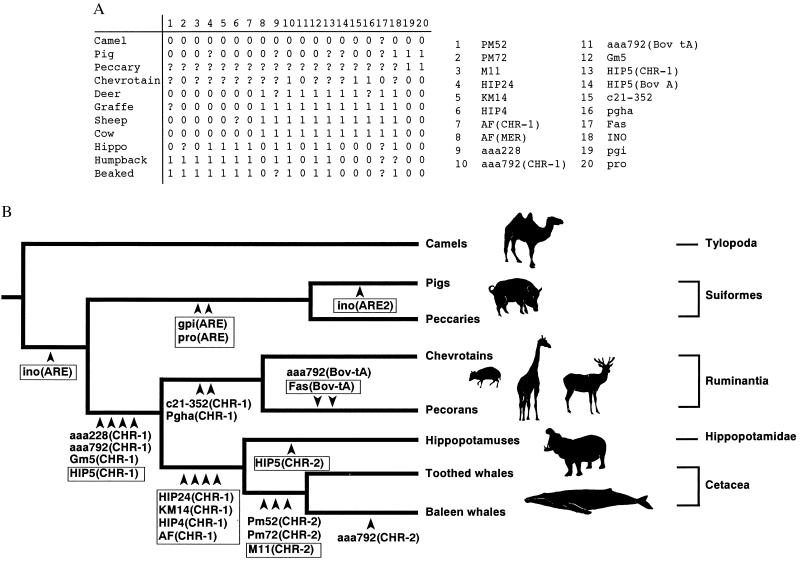
Insertion analysis of short and long interspersed elements is a powerful method for phylogenetic inference. In a previous study of short interspersed element data, it was found that cetaceans, hippopotamuses, and ruminants form a monophyletic group. To further resolve the relationships among these taxa, we now have isolated and characterized 10 additional loci. A phylogenetic analysis of these data was able to resolve relationships among the major cetartiodactyl groups, thereby shedding light on the origin of whales. The results indicated (i) that cetaceans are deeply nested within Artiodactyla, (ii) that cetaceans and hippopotamuses form a monophyletic group, (iii) that pigs and peccaries form a monophyletic group to the exclusion of hippopotamuses, (iv) that chevrotains diverged first among ruminants, and (v) that camels diverged first among cetartiodactyls. These findings lead us to conclude that cetaceans evolved from an immediate artiodactyl, not mesonychian, ancestor.


Figures

Figure 1
Figure 1
Analysis of the seven loci at which a SINE or a LINE was inserted during the evolution of Cetartiodactyla. (A-G) Data for the loci M11, KM14, HIP4, HIP24, AF, HIP5, and INO. Shown are (a) products of PCR and (b) and (c) the results of hybridization experiments using the SINE (or LINE) unit and the flanking sequence as probes, respectively. The results of hybridization with different retroposon probes are shown in d-f. The probes used were: Ed, MER; Fd, Bov-A; Fe, CHR-2; Gd, ARE; Ge, Bov-B LINE; and Gf, LINE1.
Figure 2
Figure 2
Clustering of whales and hippopotamuses at the KM14 locus.
Figure 3
Figure 3
An alignment of sequences at the KM14 locus. Dots and bars stand for identical nucleotides and deletions, respectively. Thick bars represent sites that correspond to primers, thin boxes represent direct repeats, and thick boxes represent a CHR-1 SINE.
Figure 4
Figure 4
Chevrotains diverged first among ruminants. For the Fas locus, a shows the PCR products, while the results of hybridization experiments using the Bov-A2 unit and the flanking sequence as probes are given in b and c, respectively.
Figure 5
Figure 5
Schematic representation of retropositional events at the INO locus.
Figure 6
Figure 6
Monophyly of the pig + peccary clade. For both the gpi (A) and pro (B) loci, a shows the PCR product, while the results of the hybridization experiments using the ARE unit and the flanking sequences as probes are given in b and c, respectively.
Figure 7
Figure 7
Phylogenetic relationships among the major cetartiodactyl subgroups. (A) Data matrix showing the character states for each of the loci including those reported previously (15). The 20 retropositional events were analyzed and used to generate the phylogeny shown in B. 0 = absence; 1 = presence; ? = missing. (B) All insertion sites of SINEs and LINEs characterized to date are mapped on the phylogeny inferred from these data. Boxed loci indicate those loci discussed at length in this report, and the specific retroposon unit inserted at each locus is given in parentheses. The homoplasy index was 0.0, whereas the consistency, retention, and rescaled consistency indices were 1.0 for this tree, which was 20 steps in length (where each step represents an insertion event).

Comment in

  • SINEs of the perfect character.
    Hillis DM. Hillis DM. Proc Natl Acad Sci U S A. 1999 Aug 31;96(18):9979-81. doi: 10.1073/pnas.96.18.9979. Proc Natl Acad Sci U S A. 1999. PMID: 10468541 Free PMC article. Review. No abstract available.

References

    1. Gingerich P D, Smith B H, Simons E L. Science. 1990;249:154–157. - PubMed
    1. Thewissen J G M, Hussain S T. Nature (London) 1993;361:444–445. - PubMed
    1. Thewissen J G M. J Mammal Evol. 1994;2:157–184.
    1. Fordyce R E, Barnes L G. Annu Rev Earth Planet Sci. 1994;22:419–455.
    1. Prothero D R, Manning E M, Fischer M. In: The Phylogeny and Classification of the Tetrapods. Benton M J, editor. Vol. 2. Oxford: Clarendon; 1988. pp. 201–234.

Publication types

LinkOut - more resources