. 1999 Aug 31;96(18):10422-7.
doi: 10.1073/pnas.96.18.10422.

Tracking neuronal fiber pathways in the living human brain

Affiliations

Tracking neuronal fiber pathways in the living human brain

T E Conturo et al. Proc Natl Acad Sci U S A. .

Abstract

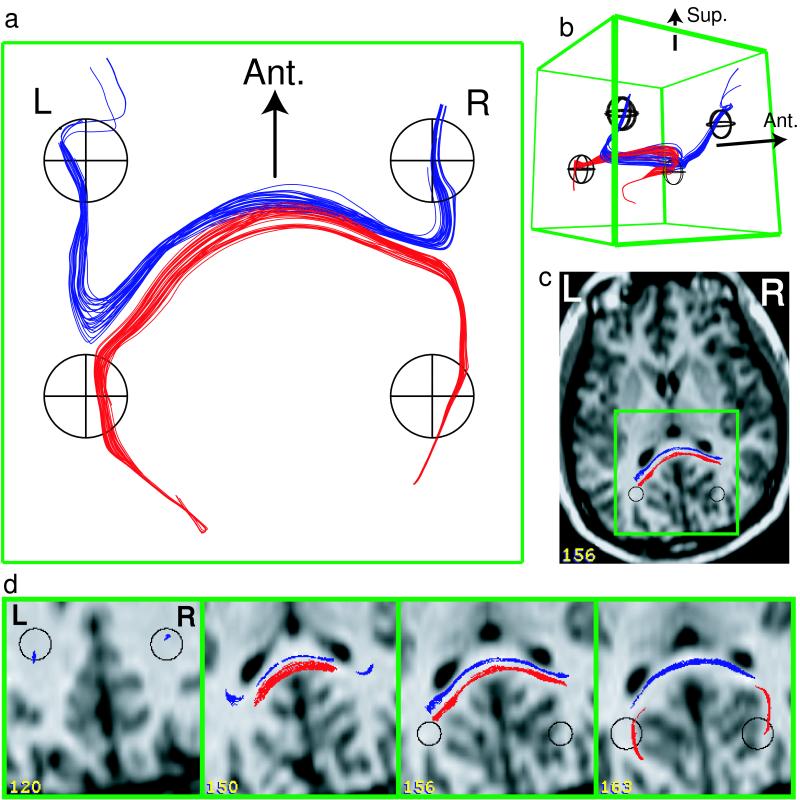
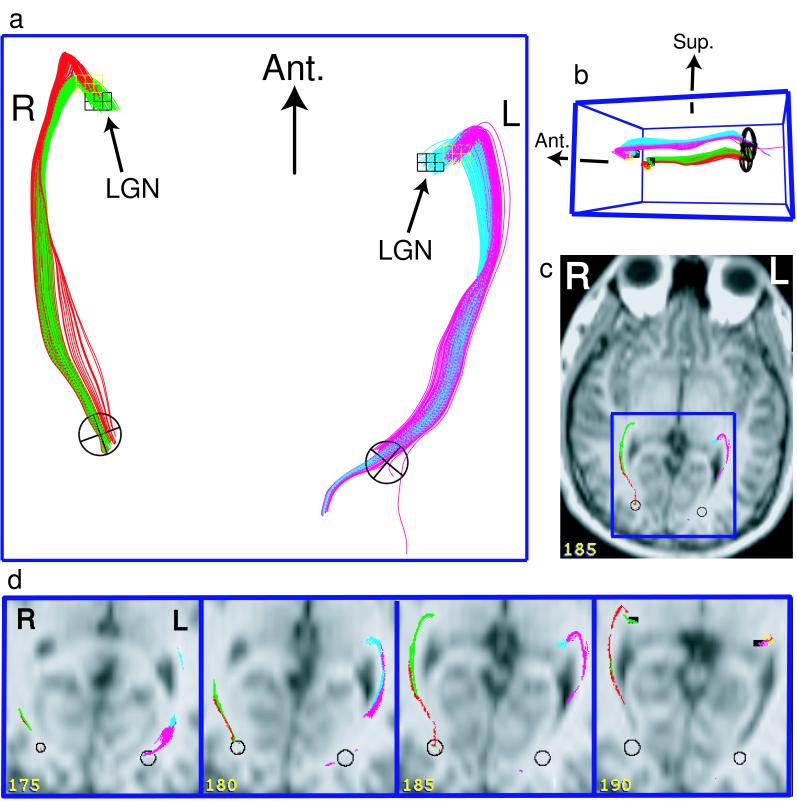
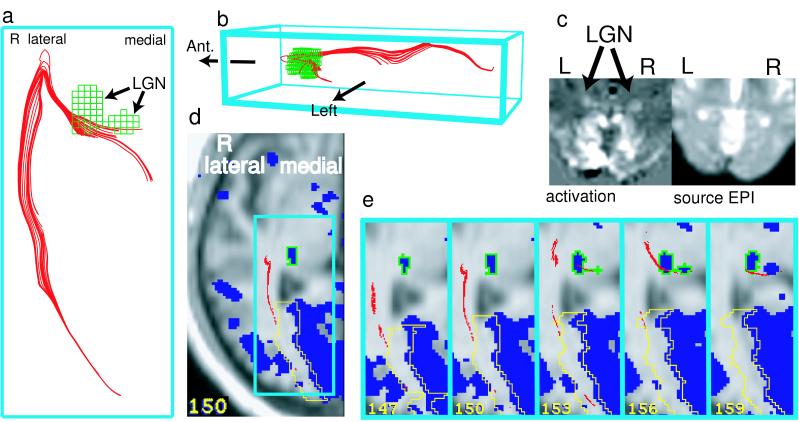
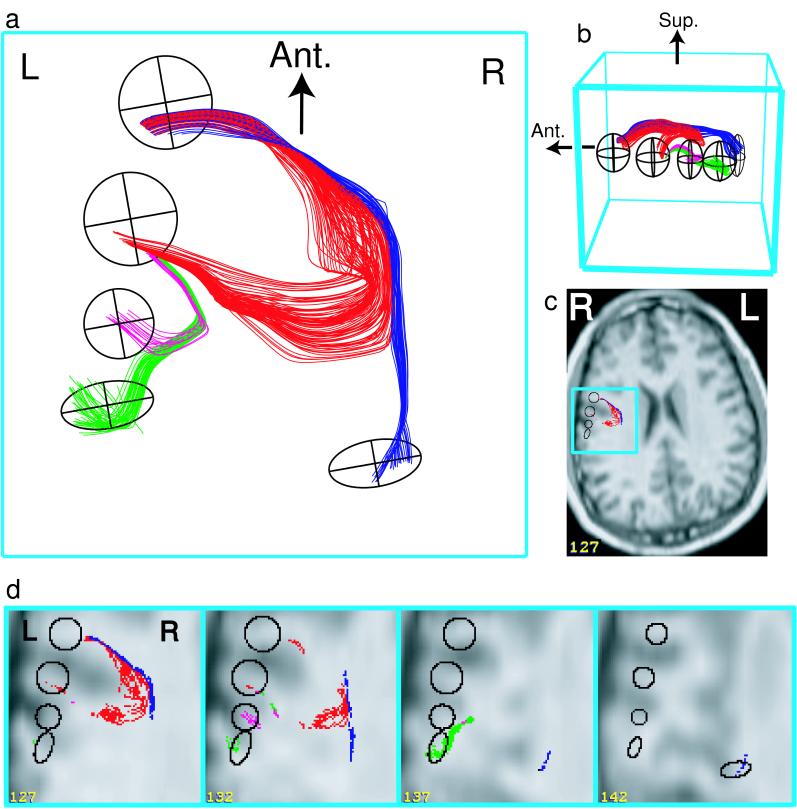
Functional imaging with positron emission tomography and functional MRI has revolutionized studies of the human brain. Understanding the organization of brain systems, especially those used for cognition, remains limited, however, because no methods currently exist for noninvasive tracking of neuronal connections between functional regions [Crick, F. & Jones, E. (1993) Nature (London) 361, 109-110]. Detailed connectivities have been studied in animals through invasive tracer techniques, but these invasive studies cannot be done in humans, and animal results cannot always be extrapolated to human systems. We have developed noninvasive neuronal fiber tracking for use in living humans, utilizing the unique ability of MRI to characterize water diffusion. We reconstructed fiber trajectories throughout the brain by tracking the direction of fastest diffusion (the fiber direction) from a grid of seed points, and then selected tracks that join anatomically or functionally (functional MRI) defined regions. We demonstrate diffusion tracking of fiber bundles in a variety of white matter classes with examples in the corpus callosum, geniculo-calcarine, and subcortical association pathways. Tracks covered long distances, navigated through divergences and tight curves, and manifested topological separations in the geniculo-calcarine tract consistent with tracer studies in animals and retinotopy studies in humans. Additionally, previously undescribed topologies were revealed in the other pathways. This approach enhances the power of modern imaging by enabling study of fiber connections among anatomically and functionally defined brain regions in individual human subjects.


Figures

Figure 1
Figure 1
Diffusion tracking of commissural fibers. 3D projection views (a and b) of diffusion tracks (red and blue) in the splenium of the corpus callosum selected with ellipsoid filtering volumes (black). Tracks are viewed from above (a) and from the anterior-right direction (b). In c, the general anatomical location of tracks and ellipsoids is shown in 2D overlay (see Methods) on a brain slice that cuts through the splenium (T1-weighted slice 156). Magnified 2D overlays (d) of tracks and ellipsoids onto selected slices (interpolated slices numbered superior-to-inferior with 24 slices/cm). The green boxed region surrounding the 3D projections (a and b) corresponds to the green squared regions on 2D anatomical overlays (c and d). Tracks were selected by ellipsoid filtration of whole-brain diffusion data (computed at an anisotropy threshold of Aσ ≥ 0.19). Tracks that passed through the splenium were observed to divide into two groups laterally and were color coded based on passage into lateral ellipsoids (black circles on all images). Tracks projected to the occipital lobes (red tracks) and parietal lobes (blue tracks), and had a topological relation within the splenium best seen in a and slice 156 in d. The oblique 3D view (b) shows the more superior projection of the parietal tracks (blue). Tracks were thinned by a factor of 8 for 3D display.
Figure 2
Figure 2
Diffusion tracking of the geniculo-calcarine tracts. 3D projections (a and b) of tracks and filtering volumes (ellipsoids and small cubes) are viewed directly from below (a) and obliquely from the left (b). In c, the general anatomical location is shown in 2D overlay on one brain slice (slice 185) that was located near the midportion of the splenium. The detailed anatomical location is shown in magnified 2D overlay in d. The dark blue boxed regions correspond on all images. Tracks were anatomically selected from whole-brain track data (Aσ ≥ 0.14 threshold, same subject as Fig. 1). Tracks were retained that entered the ellipsoidal volumes located adjacent to visual cortex (lateral to the calcarine fissure) and the ipsilateral LGN volumes (cubes) manually drawn based on thalamic contours. LGN volumes were separated into medial (black cubes) and lateral (yellow cubes) parts for analysis of topology. A medial-lateral topology is demonstrated from the LGN to the optic radiations (best seen in a), and a superior-inferior topology is revealed along the length of the geniculo-calcarine tract (best seen in b).
Figure 3
Figure 3
Functional selection of geniculo-calcarine diffusion tracks by using fMRI activations (different subject from Fig. 1; Aσ ≥ 0.11). 3D projection views (a and b) of tracks (red) and fMRI-defined LGN filtering volumes (green) viewed directly from below (a) and from the left (b). In c, the visual cortex and LGN were activated by visual stimulation (unthresholded fMRI subtraction image is displayed above the corresponding source echo-planar image). Functional selection of tracks (d and e) used activated LGN and visual cortex regions. Tracks were selected anteriorly based on passage into the LGN volume (green outline), which was traced from the total activation thresholded at ≥0.22% signal change (blue region). Tracks were selected posteriorly in the occipital lobe based on passage into a border region (yellow), which was constructed as a 1-cm band lateral to the activation in medial occipital cortex (thresholded at ≥0.41%). Border filtration was implemented because of the absence of spatial overlap between tracks and visual cortex activation (where tracks terminated at white matter borders and activations were confined to gray matter).
Figure 4
Figure 4
Diffusion tracking of parietal association fibers (same subject as Fig. 1; Aσ ≥ 0.11). 3D projections (a and b) are viewed directly from above (a) and from the left-superior direction (b). In c, a 2D anatomical overlay onto one whole brain slice (#127) demonstrates general anatomical location. Magnified 2D overlays (d) demonstrate the fine anatomical location of tracks and filtering ellipsoids. Tracts were anatomically selected as those that entered paired combinations of five ellipsoids (black), four located in subcortical white matter, and one positioned in deep white matter. Of the 10 possible paired filtering combinations, the top four combinations (displayed) yielded 93% of the tracks (107 red, 44 green, 31 blue, and 15 magenta tracks). Three of the combinations yielded zero tracks. The blue tracks end in a region of below-threshold anisotropy in deep white matter.

References

    1. Felleman D J, Van Essen D C. Cereb Cortex. 1991;1:1–47. - PubMed
    1. Fox P T, Raichle M E. Proc Natl Acad Sci USA. 1986;83:1140–1144. - PMC - PubMed
    1. Raichle M E. Annu Rev Psychol. 1994;45:333–356. - PubMed
    1. Ogawa S, Tank D W, Menon R, Ellerman J M, Kim S G, Merkle H H, Ugurbil K. Proc Natl Acad Sci USA. 1992;89:5951–5955. - PMC - PubMed
    1. Kwong K K, Belliveau J W, Chesler D A, Goldberg I E, Weisskoff R M, Poncelet B P, Kennedy D N, Hoppel B E, Cohen M S, Turner R, et al. Proc Natl Acad Sci USA. 1992;89:5675–5679. - PMC - PubMed

Publication types

LinkOut - more resources