. 1999 Aug;20(7):1309-17.

Saccular aneurysm formation in curved and bifurcating arteries

Affiliations

Saccular aneurysm formation in curved and bifurcating arteries

G N Foutrakis et al. AJNR Am J Neuroradiol. 1999 Aug.

Abstract

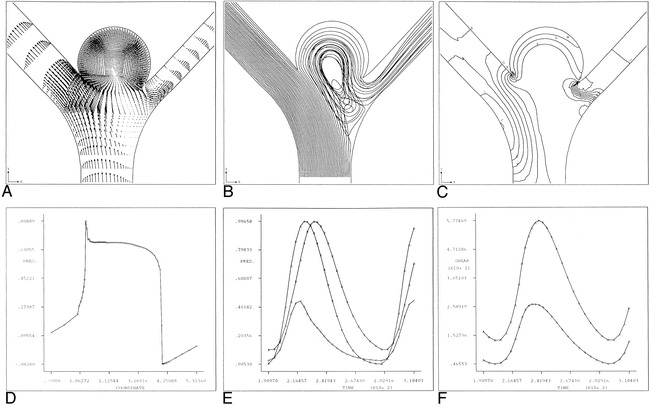
Background and purpose: Distinguishing whether forces resulting from the impingement of central blood flow streams at a curved arterial segment or at the apex of an intracranial bifurcation could be important for the understanding of aneurysm formation. Using finite element models, our purpose was to investigate the hemodynamics related to intracranial saccular aneurysm formation through computer simulations.

Methods: We present two-dimensional finite element models describing several distinct stages of aneurysm formation in both curved and bifurcating arteries. For each model, a description of the numeric solutions and results are presented.

Results: Our results suggest that the pressures and shear stresses that develop along the outer (lateral) wall of a curved artery and at the apex of an arterial bifurcation create a hemodynamic state that promotes saccular aneurysm formation. The impingement of the central stream results in greatly increased velocity/pressure gradients and high shear stresses at the apex compared with those in the proximal parent or distal daughter branches. The results also indicate that the maximal pressure generated at the apex of the arterial bifurcation ranges from two to three times the peak luminal pressure in the proximal parent artery.

Conclusion: These data suggest that, in the absence of any underlying disease process, aneurysm development is a mechanically mediated event. These models offer a plausible hypothesis regarding the initiation, growth, and subsequent rupture of saccular intracranial aneurysms as they relate to the hemodynamics of intracranial arterial blood flow.


Figures

<sc>fig</sc> 1.
fig 1.
Curved artery with aneurysm bleb. A, Instantaneous velocity vector plot of flow in curved arterial segment with aneurysm bleb during deceleration portion of systole. B, Streamline contour plot for curved arterial segment model with aneurysm bleb during deceleration portion of systole (t* = 245). Flow separation along the lateral wall and a zone of local recirculation are evident. The extent of both separation and recirculation is greatest during the deceleration portion of systole. C, Instantaneous pressures during deceleration portion of systole for curved arterial model with aneurysm bleb. Shown are pressure contours at t* = 245 and the corresponding line graph of the pressure along the outer (lateral) wall from the inlet (i) to the outlet (o). Note that the pressure is fairly constant along the body of the aneurysm, with the highest pressure occurring at the distal neck site. For reference purposes, contour A corresponds to a value of −0.362 dpu (dimensionless pressure units) whereas contour O corresponds to a value of 0.555 dpu. D, Pressure history plot for curved arterial model with aneurysm bleb showing pressure at proximal and distal aneurysm necks over one cardiac cycle. Curve A corresponds to the segment inlet, Curve B corresponds to the proximal aneurysm neck site and Curve C corresponds to the distal neck site. E, Time history plot of shear rates at proximal and distal aneurysm necks. Curves A and B correspond to the proximal and distal neck sites, respectively. Note that the shear rate values at the distal neck exceed those of the proximal neck throughout the entire cardiac cycle.
<sc>fig</sc> 2.
fig 2.
Curved artery with saccular aneurysm. A, Instantaneous velocity vector plot of flow in curved arterial segment with saccular aneurysm during deceleration portion of systole. B, Continuous particle paths for t* = 200–400 for fully developed saccular aneurysm model. Initially the particles were aligned across the main lumen at the location of the proximal aneurysm neck. C, Instantaneous pressure contours during deceleration portion of systole for the curved arterial model with a fully developed aneurysm. Shown here are pressure contours at dimensionless time, t* = 245. Here, contour A corresponds to a value of 0.531 dpu (dimensionless pressure units) while contour M corresponds to a value of 0.563 dpu. D, Pressure history plot for curved arterial segment model with saccular aneurysm showing pressure at proximal and distal aneurysm necks over one cardiac cycle. Curve A corresponds to the segment inlet, Curve B corresponds to the proximal aneurysm neck site (node 851) and Curve C corresponds to the distal neck site (node 1251). E, Time history plot of shear rates at proximal and distal aneurysm necks. Curve A and B correspond to the proximal (node 851) and distal (node 1251) neck sites, respectively. Note that the shear rate values at the distal neck exceed those of the proximal neck throughout the entire cardiac cycle.
<sc>fig</sc> 3.
fig 3.
Arterial bifurcation with aneurysm bleb. A, Instantaneous velocity vector plot of flow in arterial bifurcation model with aneurysm bleb during deceleration portion of systole. B, Continuous particle paths for t* = 200–400 for arterial bifurcation model with aneurysm bleb. Initially the particles were aligned across the lumen of the parent artery proximal to the bifurcation. C, Instantaneous pressure contours for arterial bifurcation model with aneurysm bleb during deceleration portion of cardiac systole (t* = 245). Plot corresponds to time of maximal pressure at bifurcation. For reference purposes, contour A corresponds to a value of -0.567 dpu (dimensionless pressure units) whereas contour J corresponds to a value of 1.757 dpu. D, Line plot of instantaneous pressure along arterial wall corresponding to figure 3E. Location of maximal pressure corresponds to location of stagnation point at aneurysm neck site N1. E, Pressure time history plot for asymmetrical arterial bifurcation model with aneurysm bleb over one cardiac cycle. Curve A corresponds to the vessel inlet, Curve B corresponds to the aneurysm neck site N1 and Curve C corresponds to the aneurysm neck site N2. F, Time history plot of shear rates for asymmetric arterial bifurcation model with aneurysm bleb at aneurysm neck sites N1 and N2. Curve A and B correspond to aneurysm neck sites N1 and N2, respectively. Note that the shear rate values at N2 exceed those of N1 throughout the entire cardiac cycle.
<sc>fig</sc> 4.
fig 4.
Arterial bifurcation with saccular aneurysm. A, Instantaneous velocity vector plot of flow in arterial bifurcation model with saccular aneurysm during deceleration portion of systole. B, Continuous particle paths for t* = 200–400 for arterial bifurcation model with saccular aneurysm. Initially the particles were aligned across the lumen of the parent artery. C, Instantaneous pressure contours for arterial bifurcation model with saccular aneurysm during deceleration portion of cardiac systole (t* = 245). Plot corresponds to time of maximal pressure at bifurcation. For reference purposes, contour A corresponds to a value of -0.308 dpu (dimensionless pressure units) whereas contour O corresponds to a value of 1.535 dpu. D, Line plot of instantaneous pressure along arterial wall corresponding to figure 4C. Shown is the pressure along arterial wall and aneurysm dome from node 2189 to node 2231. Location of maximal pressure corresponds to location of stagnation point at aneurysm neck site N1. E, Pressure time history plot for arterial bifurcation model with saccular aneurysm over one cardiac cycle. Curve A corresponds to the vessel inlet, Curve B corresponds to the aneurysm neck site N1 and Curve C corresponds to the aneurysm neck site N2. Note the secondary rise in pressure at the neck N2. This pressure oscillation may give rise to vibrations at the neck site and further increase the chance of structural fatigue. F, Time history plot of shear rates for arterial bifurcation model with saccular aneurysm at aneurysm necks sites N1 and N2. Curves A and B correspond to aneurysm neck sites N1 and N2, respectively. Note that the shear rate values at N2 exceed those of N1 throughout the entire cardiac cycle.
<sc>fig</sc> 5.
fig 5.
Arterial bifurcation with wide-mouthed saccular aneurysm. A, Instantaneous velocity vector plot of flow in arterial bifurcation model with wide-mouthed saccular aneurysm during deceleration portion of systole. B, Continuous particle paths for t* = 200–400 for arterial bifurcation model with wide-mouthed saccular aneurysm. Initially the particles were aligned across the lumen of the parent artery. C, Instantaneous pressure contours for arterial bifurcation model with wide-mouthed saccular aneurysm during deceleration portion of cardiac systole (t* = 245). Plot corresponds to time of maximal pressure at bifurcation. For reference purposes, contour A corresponds to a value of -0.135 dpu (dimensionless pressure units), whereas contour O corresponds to a value of 0.776 dpu. D, Line plot of instantaneous pressure along arterial wall corresponding to figure 5C. Location of maximal pressure corresponds to location of stagnation point at aneurysm neck site N1. E, Pressure time history plot for arterial bifurcation with wide-mouthed edsaccular aneurysm over one cardiac cycle. Curve A corresponds to the vessel inlet, Curve B corresponds to the aneurysm neck site N1, and Curve C corresponds to the aneurysm neck site N2. F, Time history plot of shear rates for arterial bifurcation with wide-mouthed saccular aneurysm at aneurysm necks site N1 and N2. Curves A and B correspond to aneurysm neck sites N1 and N2, respectively. Note that the shear rate values at N1 exceed those of N2 throughout the entire cardiac cycle.

References

    1. Campbell GJ, Eng P, Roach MR. Fenestrations in the internal elastic lamina at bifurcations of human carotid arteries. Stroke 1981;12:489-496 - PubMed
    1. Ferguson GG. Physical factors in the initiation, growth, and rupture of human intracranial saccular aneurysms. J Neurosurg 1972;37:666-677 - PubMed
    1. Foutrakis GN, Yonas H, Sclabassi RJ. Finite element methods in the simulation and analysis of intracranial blood flow. Neurological Research 1997;19:174-186 - PubMed
    1. Nicholas WW, O'Rourke MF. McDonald's Blood Flow in Arteries: Theoretical, Experimental and Clinical Principles. 3rd ed. Philadelphia, Pa: Lea and Febiger; 1990
    1. Forbus WD. On the origin of miliary aneurysms of superficial cerebral arteries. Bulletin of the Johns Hopkins Hospital 1930;47:239-284

Publication types

MeSH terms