

Impact of rpoS deletion on Escherichia coli biofilms
- PMID: 10473455
- PMCID: PMC99780
- DOI: 10.1128/AEM.65.9.4285-4287.1999
Impact of rpoS deletion on Escherichia coli biofilms
Abstract
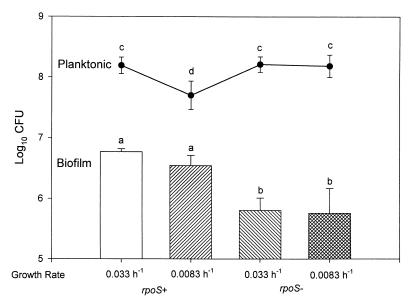
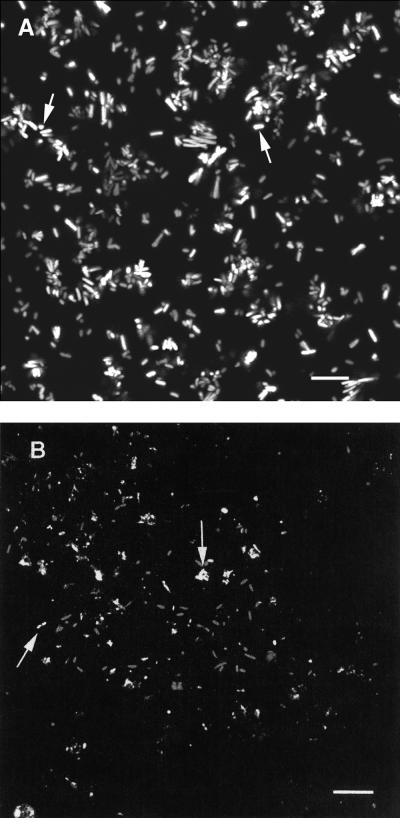
Slow growth has been hypothesized to be an essential aspect of bacterial physiology within biofilms. In order to test this hypothesis, we employed two strains of Escherichia coli, ZK126 (DeltalacZ rpoS(+)) and its isogenic DeltarpoS derivative, ZK1000. These strains were grown at two rates (0.033 and 0.0083 h(-1)) in a glucose-limited chemostat which was coupled either to a modified Robbins device containing plugs of silicone rubber urinary catheter material or to a glass flow cell. The presence or absence of rpoS did not significantly affect planktonic growth of E. coli. In contrast, biofilm cell density in the rpoS mutant strain (ZK1000), as measured by determining the number of CFU per square centimeter, was reduced by 50% (P < 0.05). Deletion of rpoS caused differences in biofilm cell arrangement, as seen by scanning confocal laser microscopy. In reporter gene experiments, similar levels of rpoS expression were seen in chemostat-grown planktonic and biofilm populations at a growth rate of 0.033 h(-1). Overall, these studies suggest that rpoS is important for biofilm physiology.
Figures
References
-
- Davies D G, Parsek M R, Pearson J P, Iglewski B H, Costerton J W, Greenberg E P. The involvement of cell-to-cell signals in the development of a bacterial biofilm. Science. 1998;280:295–298. - PubMed
-
- Evans D J, Brown M R W, Allison D G, Gilbert P. Susceptibility of bacterial biofilms to tobramycin: role of specific growth rate and phase in the division cycle. J Antimicrob Chemother. 1990;25:585–591. - PubMed
-
- Gilbert P, Das J, Foley I. Biofilm susceptibility to antimicrobials. Adv Dent Res. 1997;11:160–167. - PubMed
-
- Lange R, Hengge-Aronis R. The cellular concentration of the sigma-S subunit of RNA polymerase in Escherichia coli is controlled at the levels of transcription, translation and protein stability. Genes Dev. 1994;8:1600–1612. - PubMed
Publication types
MeSH terms
Substances
LinkOut - more resources
Full Text Sources
