. 1999 Sep 6;190(5):597-605.
doi: 10.1084/jem.190.5.597.

The B-oligomer of pertussis toxin deactivates CC chemokine receptor 5 and blocks entry of M-tropic HIV-1 strains

Affiliations

The B-oligomer of pertussis toxin deactivates CC chemokine receptor 5 and blocks entry of M-tropic HIV-1 strains

M Alfano et al. J Exp Med. .

Abstract

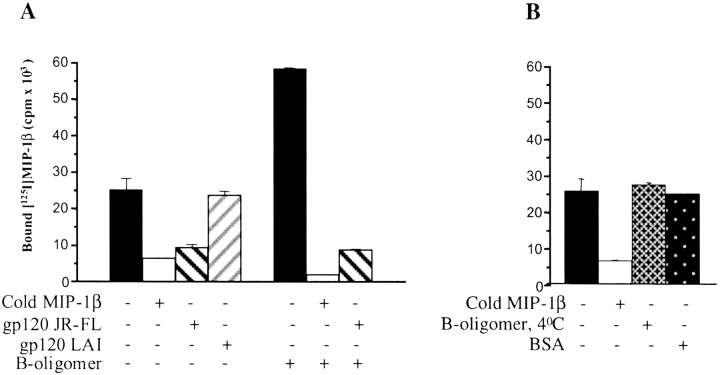
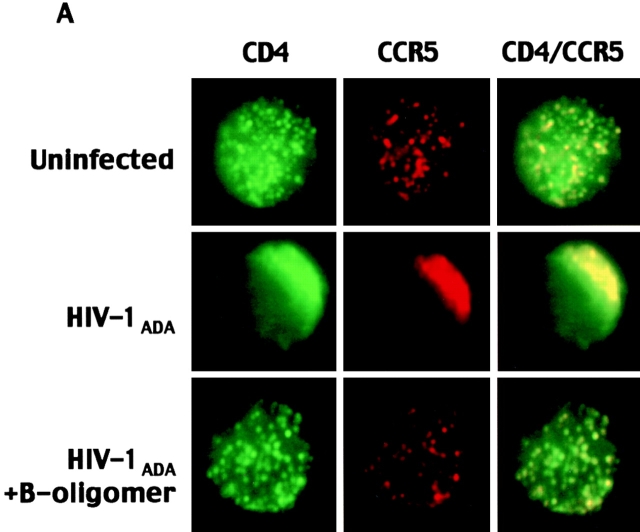
Infection of target cells by HIV-1 requires initial binding interactions between the viral envelope glycoprotein gp120, the cell surface protein CD4, and one of the members of the seven-transmembrane G protein-coupled chemokine receptor family. Most primary isolates (R5 strains) use chemokine receptor CCR5, but some primary syncytium-inducing, as well as T cell line-adapted, strains (X4 strains) use the CXCR4 receptor. Signaling from both CCR5 and CXCR4 is mediated by pertussis toxin (PTX)-sensitive G(i) proteins and is not required for HIV-1 entry. Here, we show that the PTX holotoxin as well as its binding subunit, B-oligomer, which lacks G(i)-inhibitory activity, blocked entry of R5 but not X4 strains into primary T lymphocytes. Interestingly, B-oligomer inhibited virus production by peripheral blood mononuclear cell cultures infected with either R5 or X4 strains, indicating that it can affect HIV-1 replication at both entry and post-entry levels. T cells treated with B-oligomer did not initiate signal transduction in response to macrophage inflammatory protein (MIP)-1beta or RANTES (regulated upon activation, normal T cell expressed and secreted); however, cell surface expression of CCR5 and binding of MIP-1beta or HIV-1 to such cells were not impaired. The inhibitory effect of B-oligomer on signaling from CCR5 and on entry of R5 HIV-1 strains was reversed by protein kinase C (PKC) inhibitors, indicating that B-oligomer activity is mediated by signaling events that involve PKC. B-oligomer also blocked cocapping of CCR5 and CD4 induced by R5 HIV-1 in primary T cells, but did not affect cocapping of CXCR4 and CD4 after inoculation of the cultures with X4 HIV-1. These results suggest that the B-oligomer of PTX cross-deactivates CCR5 to impair its function as a coreceptor for HIV-1.


Figures

Figure 1
Figure 1
The effect of PTX and B-oligomer on HIV-1 entry. (A) Monocyte-depleted PBMC cultures were treated with PTX (1 nM) or left untreated (control), and inoculated with R5 HIV-192US660 or X4 HIV-1LAI. Viral entry was analyzed by PCR using primers LTR R/U5 specific for the early reverse transcription product, as described previously 34. Results were quantified on a Direct Imager (Packard Instrument Company) and are presented as a percentage of counts in treated versus control samples. The error bars show the deviation from the mean for triplicate samples. Similar results were obtained in two independent experiments with cells from different donors. (B) Cells were treated with the indicated concentrations of B-oligomer or an anti-CD4 mAb Leu3A for 10 min or were left untreated and inoculated with HIV-192US660 (left) or HIV-1LAI (middle). Viral entry was analyzed as in A. In parallel, each sample was amplified with α-tubulin–specific primers to control for the total amount of DNA. Results were quantified on a Packard Direct Imager and are presented on bar graphs as mean counts for each set of duplicate samples, expressed as counts per minute (cpm). The error bars show the deviation from the mean for each duplicate. Uninfected cells (Neg.) served as negative control. Dilutions of 8E5/LAI cells containing one HIV-1 genome per cell 45 were used as PCR standards (right).
Figure 2
Figure 2
B-oligomer inhibits HIV-1 replication. For in vitro infection, monocyte-depleted PBMCs from HIV seronegative donor or PM1 T cell line (insets) were pretreated for 1 h with 1 nM of B-oligomer and infected with primary R5 (92US660, panel A) or X4 (92UG21, panel B) strains, or T cell line–adapted X4 virus LAI (panel C). Subsequent culturing was in the presence of 1 nM of B-oligomer. For direct analysis of clinical isolates, monocyte-depleted PBMCs from HIV-1–infected patients were activated for three days with PHA and then cocultured with similarly activated PBMCs from uninfected donors in the presence of the indicated concentrations of B-oligomer (panel D). Virus replication was assayed in triplicate cultures, and error bars show the standard deviations of the mean. A representative experiment out of three performed with cells from different donors or patients is shown. The uptake of [3H]thymidine was measured in triplicate long-term cultures of uninfected PBMCs treated with indicated concentrations of B-oligomer (panel E). Error bars show standard deviation of the mean. In parallel we measured the number of cells in each culture (Fig. 2 E, inset).
Figure 2
Figure 2
B-oligomer inhibits HIV-1 replication. For in vitro infection, monocyte-depleted PBMCs from HIV seronegative donor or PM1 T cell line (insets) were pretreated for 1 h with 1 nM of B-oligomer and infected with primary R5 (92US660, panel A) or X4 (92UG21, panel B) strains, or T cell line–adapted X4 virus LAI (panel C). Subsequent culturing was in the presence of 1 nM of B-oligomer. For direct analysis of clinical isolates, monocyte-depleted PBMCs from HIV-1–infected patients were activated for three days with PHA and then cocultured with similarly activated PBMCs from uninfected donors in the presence of the indicated concentrations of B-oligomer (panel D). Virus replication was assayed in triplicate cultures, and error bars show the standard deviations of the mean. A representative experiment out of three performed with cells from different donors or patients is shown. The uptake of [3H]thymidine was measured in triplicate long-term cultures of uninfected PBMCs treated with indicated concentrations of B-oligomer (panel E). Error bars show standard deviation of the mean. In parallel we measured the number of cells in each culture (Fig. 2 E, inset).
Figure 3
Figure 3
B-oligomer does not block ligand binding to CCR5. Analysis of 125I-labeled MIP-1β binding to untreated or B-oligomer–treated PBMCs was performed as described in Materials and Methods. Binding was also measured in the presence of either a 1,000-fold molar excess of unlabeled (cold) MIP-1β, or 0.5 μg/ml of gp120 of an R5 (JR-FL) or X4 (LAI) HIV-1 strain (A). To control for nonspecific effects of the B-oligomer, binding was analyzed also using cells treated either with B-oligomer (1 nM) at 4°C, or with 75 ng/ml of BSA at 37°C (B). Results are presented as means of duplicate samples, and the error bars show the deviation from the mean for each duplicate.
Figure 5
Figure 5
The effect of B-oligomer on CCR5 is reversed by PKC inhibitor. (A) Ro-31-8220 reverses the inhibitory effect of B-oligomer on entry of R5 strains. PBMC cultures were either left untreated (control) or treated with B-oligomer (1 nM for 10 min) with or without Ro-31-8220 (pretreatment for 20 min with 10 nM of the inhibitor). Entry of R5 (92US660) or X4 (LAI) strains of HIV-1 was measured as described in the legend to Fig. 1. Results are presented as mean of two independent experiments with cells from the same donor. The error bars show the deviation from the mean for duplicate samples. Similar results were obtained with cells from a different donor. (B) Ro-31-8220 reverses the inhibitory effect of B-oligomer on signaling from CCR5. PBMC cultures were either treated with B-oligomer (1 nM) alone or in combination with Ro-31-8220 (10 nM) (panels a and c) or left untreated (control) or treated with Ro-31-8220 (100 nM) alone (panels b and d) and stimulated with 500 ng/ml of RANTES (panels a and b) or 100 ng/ml of SDF-1α (panels c and d) at the time indicated by the arrow. Ca2+ flux was measured as described in the legend to Fig. 4.
Figure 4
Figure 4
Analysis of cross-desensitization of chemokine and PTX receptors. Fura-2–loaded PBMCs were stimulated with 0.83 μg/ml of B-oligomer (B-ol.) (A and B), 1.66 μg/ml of MIP-1β (C), or 0.1 μg/ml of SDF-1α (D) at the time indicated by the left arrow. At the time indicated by the right arrow (3–5 min later), cells were rechallenged with B-oligomer (C and D), MIP-1β (A), or SDF-1α (B) at the same concentration as in the first challenge. Results of one representative experiment out of three performed with cells from different donors are presented as the ratio of fluorescence emissions at 340 and 380 nm (F340/F380) over time.
Figure 6
Figure 6
Analysis of receptor capping by immunofluorescent microscopy. PBMCs were treated with 1 nM of B-oligomer for 10 min or left untreated, and receptor capping was analyzed by a dual-color immunofluorescent microscopy after inoculation with R5 HIV-192US660 (A) or X4 HIV-1LAI (B) viruses. CD4 was revealed with FITC-conjugated anti-CD4 mAb (thus producing green fluorescence), while chemokine receptors were stained with unlabeled primary and rhodamine-labeled secondary antibody (red fluorescence). Colocalization of receptors resulted in overlapping of red and green fluorescence, thus producing yellow color. Approximately 50 and 30% of CD4/CCR5 and CD4/CXCR4 double-positive cells, respectively, exhibited capping.
Figure 6
Figure 6
Analysis of receptor capping by immunofluorescent microscopy. PBMCs were treated with 1 nM of B-oligomer for 10 min or left untreated, and receptor capping was analyzed by a dual-color immunofluorescent microscopy after inoculation with R5 HIV-192US660 (A) or X4 HIV-1LAI (B) viruses. CD4 was revealed with FITC-conjugated anti-CD4 mAb (thus producing green fluorescence), while chemokine receptors were stained with unlabeled primary and rhodamine-labeled secondary antibody (red fluorescence). Colocalization of receptors resulted in overlapping of red and green fluorescence, thus producing yellow color. Approximately 50 and 30% of CD4/CCR5 and CD4/CXCR4 double-positive cells, respectively, exhibited capping.

Comment in

References

    1. Maddon P.J., Dalgleish A.G., McDougal J.S., Clapham P.R., Weiss R.A., Axel R. The T4 gene encodes the AIDS virus receptor and is expressed in the immune system and the brain. Cell. 1986;47:333–348. - PubMed
    1. Bieniasz P.D., Cullen B.R. Chemokine receptors and human immunodeficiency virus infection. Front. Biosci. (Online). 1998;3:D44–D58. - PubMed
    1. Alkhatib G., Combadiere C., Broder C.C., Feng Y., Kennedy P.E., Murphy P.M., Berger E.A. CC CKR5a RANTES, MIP-1α, MIP-1β receptor as a fusion cofactor for macrophage-tropic HIV-1. Science. 1996;272:1955–1958. - PubMed
    1. Choe H., Farzan M., Sun Y., Sullivan N., Rollins B., Ponath P.D., Wu L., Mackay C.R., LaRosa G., Newman W. The beta-chemokine receptors CCR3 and CCR5 facilitate infection by primary HIV-1 isolates. Cell. 1996;85:1135–1148. - PubMed
    1. Deng H., Liu R., Ellmeier W., Choe S., Unutmaz D., Burkhart M., Di Marzio P., Marmon S., Sutton R.E., Hill C.M. Identification of a major co-receptor for primary isolates of HIV-1. Nature. 1996;381:661–666. - PubMed

Publication types

MeSH terms