. 1999 Sep 6;190(5):639-49.
doi: 10.1084/jem.190.5.639.

Autoantigen-specific B cell activation in Fas-deficient rheumatoid factor immunoglobulin transgenic mice

Affiliations

Autoantigen-specific B cell activation in Fas-deficient rheumatoid factor immunoglobulin transgenic mice

H Wang et al. J Exp Med. .

Abstract

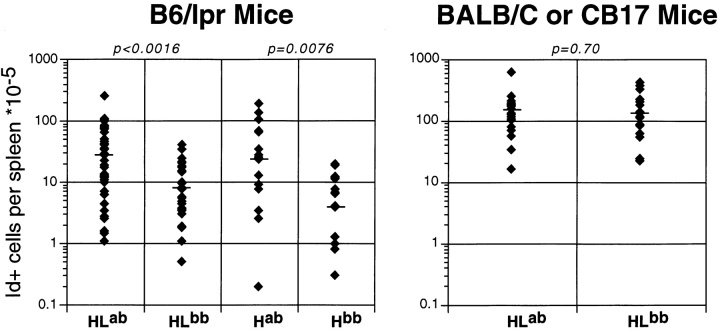
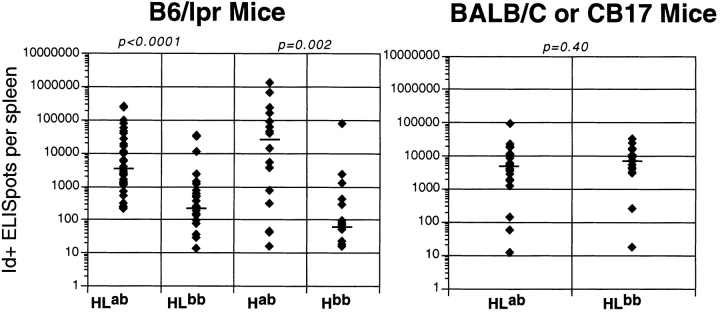
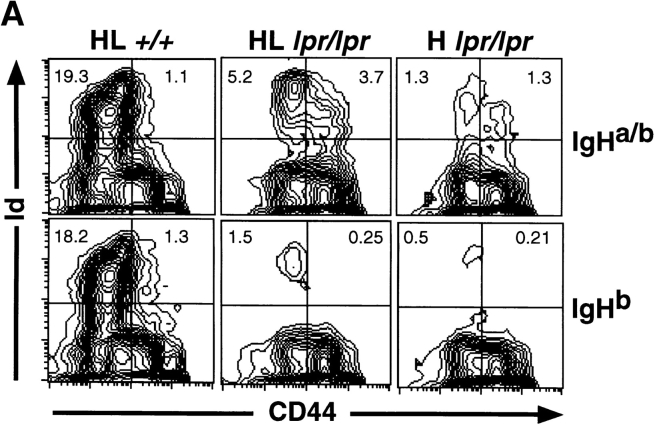
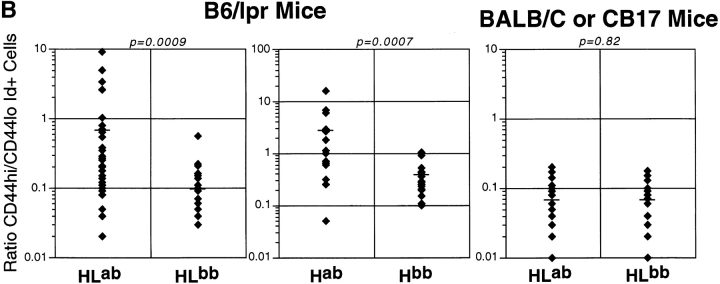
In systemic autoimmune disease, self-tolerance fails, leading to autoantibody production. A central issue in immunology is to understand the origins of activated self-reactive B cells. We have used immunoglobulin (Ig) transgenic mice to investigate the regulation of autoreactive B cells with specificity for self-IgG2a (the rheumatoid factor [RF] specificity) to understand how normal mice regulate RF autoantibodies and how this fails in autoimmune mice. We previously showed that normal mice do not tolerize the AM14 RF clone, nor do they appear to activate it. Here we show that in Fas-deficient autoimmune mice, the picture is quite different. RF B cells are activated to divide and secrete, but only when the autoantigen is present. Thus, B cells that are ignored rather than anergized in normal mice can be stimulated to produce autoantibody in Fas-deficient mice. This demonstrates a novel developmental step at which intact Fas-Fas ligand signaling is required to regulate B cells in order to prevent autoimmunity. These data also establish the relevance of ignorant self-specific B cells to autoantibody production in disease and prove that in the case of the RF specificity, the nominal autoantigen IgG2a is the driving autoantigen in vivo.


Figures

Figure 1
Figure 1
Increased numbers of RF Id+ cells in spleens of Tgic mice with AutoAg. The y-axis shows on a logarithmic scale the calculated numbers of Id+ cells based on total cell counts and the percentage of Id+ cells determined by FACS™ analysis. Each diamond is an individual mouse, and the horizontal bar is the median. Mouse genotypes are shown on the category axis as follows: HL, both heavy and light Tgs; H, heavy Tg only; ab, heterozygous for IgHa and IgHb allotypes (i.e., autoAg present); bb, homozygous for the IgHb allotype (autoAg absent). Left panel, B6/lpr-derived strains; right panel, BALB/c-derived strains. P values for comparisons between each autoAg-positive versus -negative group are shown above the graphs. The numbers of mice analyzed are: 41 HLab, 31 HLb, 17 Hab, 17 Hb, 23 BALB/c HLab, and 19 CB.17 HLb.
Figure 3
Figure 3
Increased numbers of Id+ ELISpots in spleens of Tgic mice with autoAg. The y-axis shows on a logarithmic scale the calculated numbers of Id+ ELISpots based on total cell counts and the number of Id+ ELISpots determined on a measured number of cells as described in Materials and Methods. The layout of the figure is otherwise as in Fig. 1. The numbers of mice analyzed are: 38 HLab, 29 HLb, 16 Hab, 16 Hb, 22 BALB/c HLab, and 19 CB.17 HLb.
Figure 2
Figure 2
Increased fraction of CD44hi Id+ B cells in spleens of Tgic mice with autoAg. (A) Representative FACS™ data from typical mice from a single experiment. Staining with anti–Id 4-44 is shown on the y-axis and anti-CD44 is on the x-axis. 4% contour plots are depicted. The percentage of total lymphocytes in the upper quadrants is shown. Left panels show HL+/+ mice that are wild-type at Fas (BALB/c-derived strains). Center and right panels are from B6/lpr-derived strains, with the center panels from HL Tgics and the right from H Tgics. As indicated, the top row is from mice that express the autoAg (IgHab), and the bottom row is from mice that lack the autoAg (IgHb). (B) Summary of FACS™ data as represented in A for all analyzed mice. The y-axis shows on a logarithmic scale the ratio of CD44hi (top right quadrant in A) to CD44lo (top left quadrant in A). Each diamond is an individual mouse, and the horizontal bar is the mean. The layout of the figure is otherwise as in Fig. 1. The numbers of mice analyzed are: 38 HLab, 29 HLb, 17 Hab, 16 Hb, 22 BALB/c HLab, and 19 CB.17 HLb.
Figure 2
Figure 2
Increased fraction of CD44hi Id+ B cells in spleens of Tgic mice with autoAg. (A) Representative FACS™ data from typical mice from a single experiment. Staining with anti–Id 4-44 is shown on the y-axis and anti-CD44 is on the x-axis. 4% contour plots are depicted. The percentage of total lymphocytes in the upper quadrants is shown. Left panels show HL+/+ mice that are wild-type at Fas (BALB/c-derived strains). Center and right panels are from B6/lpr-derived strains, with the center panels from HL Tgics and the right from H Tgics. As indicated, the top row is from mice that express the autoAg (IgHab), and the bottom row is from mice that lack the autoAg (IgHb). (B) Summary of FACS™ data as represented in A for all analyzed mice. The y-axis shows on a logarithmic scale the ratio of CD44hi (top right quadrant in A) to CD44lo (top left quadrant in A). Each diamond is an individual mouse, and the horizontal bar is the mean. The layout of the figure is otherwise as in Fig. 1. The numbers of mice analyzed are: 38 HLab, 29 HLb, 17 Hab, 16 Hb, 22 BALB/c HLab, and 19 CB.17 HLb.
Figure 4
Figure 4
Histologic analysis of spleens. Frozen sections of spleens from representative mice were stained with anti-CD3 (blue) and 4-44 anti-Id (gold). A, C, and E are from IgHab mice, and B, D, and F are IgHb. A–D, B6/lpr mice; E and F, BALB/c background mice. A, B, E, and F are HL mice, whereas C and D show spleens from H-only Tgic mice. T cell zones are indicated by T; foci of darkly staining Id+ plasma cells are shown by arrows. Asterisks indicate T–B cell borders in which Id19 B cells are mixing with adjacent T cells. HLab (A) and Hab (C) are remarkable for large numbers of Id19 plasma cells as well as lighter-staining Id19 cells, both of which are absent in the IgHb congenics (B and D). Fas-sufficient mice (E and F) show normal histology, with well-defined T and B zones with most Id+ cells in the follicles and few plasma cells. There are no remarkable differences between the allotype congenics in E and F.
Figure 5
Figure 5
Increased percentage of B220+ T cells in spleens of Tgic mice with the autoAg. B220+ T cells were identified by FACS™ analysis as described in Materials and Methods. The y-axis shows percentages from individual mice. Each diamond is an individual mouse, and the horizontal bar is the mean. The layout of the figure is otherwise as in Fig. 1. Only B6/lpr mice are shown in this figure, as the percentages in the BALB/c-derived strains were negligible. The numbers of mice analyzed are: 39 HLab, 29 HLb, 18 Hab, 17 Hb, 18 Nab, and 19 Nb.

Similar articles

Cited by

References

    1. Tan E.M. Antinuclear antibodiesdiagnostic markers for autoimmune diseases and probes for cell biology. Adv. Immunol. 1989;44:93–151. - PubMed
    1. Madaio M.P., Carlson J., Cataldo J., Ucci A., Migliorini P., Pankewycz O. Murine monoclonal anti-DNA antibodies bind directly to glomerular antigens and form immune deposits. J. Immunol. 1987;138:2883–2889. - PubMed
    1. Raz E., Brezis M., Rosenmann E., Eilat D. Anti-DNA antibodies bind directly to renal antigens and induce kidney dysfunction in the isolated perfused rat kidney. J. Immunol. 1989;142:3076–3082. - PubMed
    1. Lefkowith J.B., Gilkeson G.S. Nephritogenic autoantibodies in lupus. Arthritis Rheum. 1996;39:894–903. - PubMed
    1. Chan O., Shlomchik M.J. A new role for B cells in systemic autoimmunityB cells promote spontaneous T cell activation in MRL-lpr/lpr mice. J. Immunol. 1998;160:51–59. - PubMed

Publication types

MeSH terms