. 1999 Sep 6;190(5):669-79.
doi: 10.1084/jem.190.5.669.

A novel element upstream of the Vgamma2 gene in the murine T cell receptor gamma locus cooperates with the 3' enhancer to act as a locus control region

Affiliations

A novel element upstream of the Vgamma2 gene in the murine T cell receptor gamma locus cooperates with the 3' enhancer to act as a locus control region

J E Baker et al. J Exp Med. .

Abstract

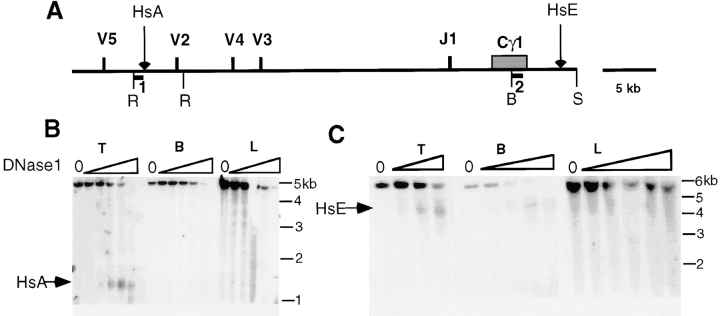
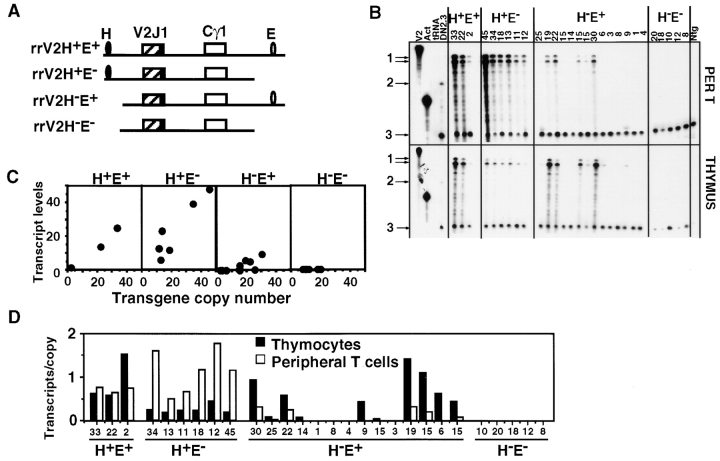
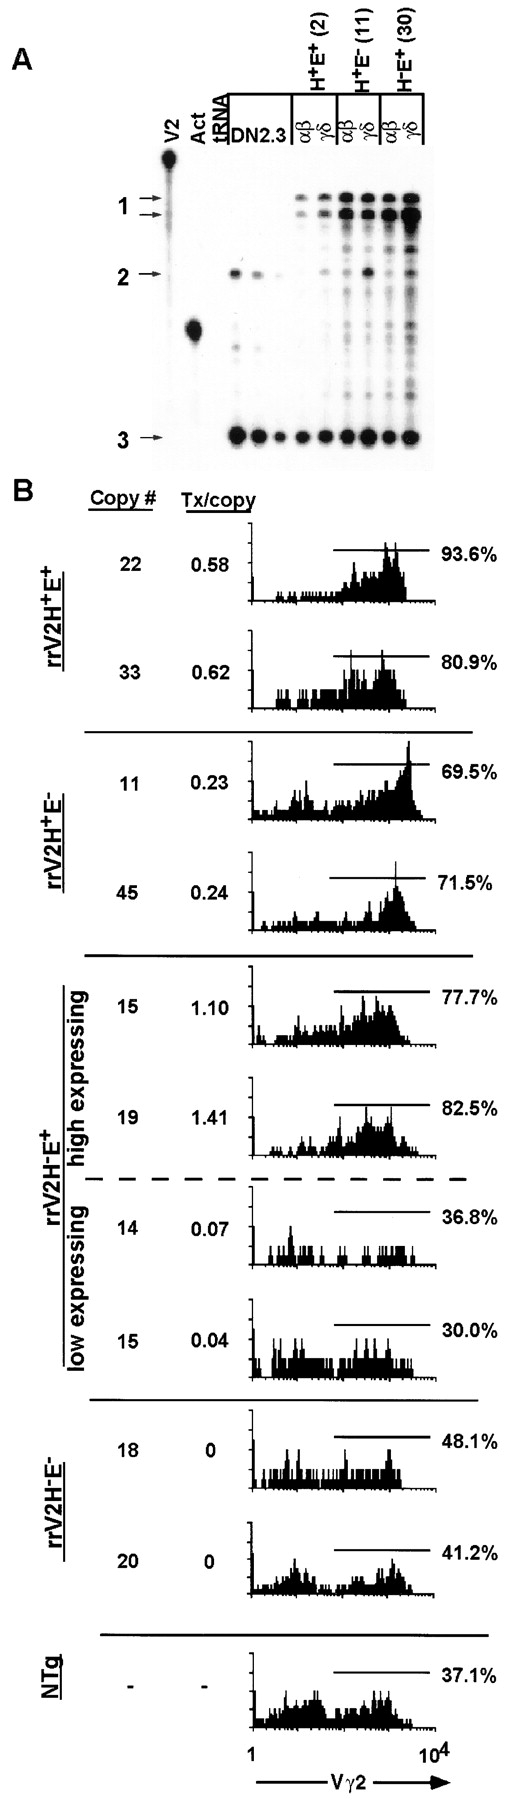
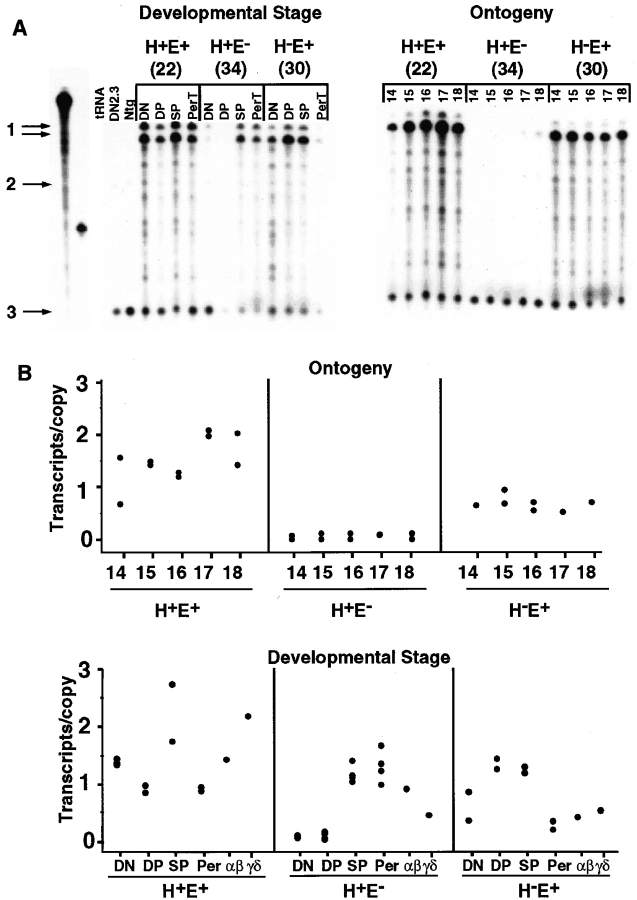
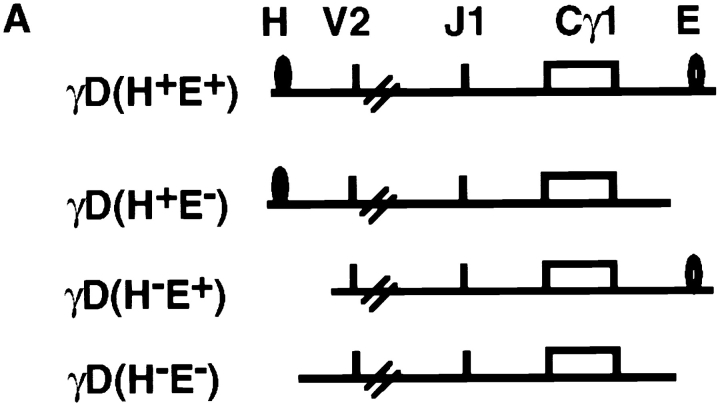
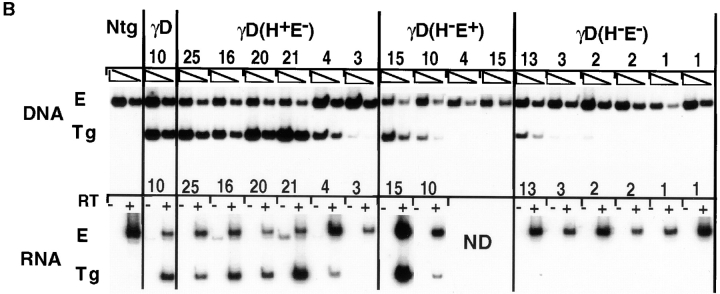
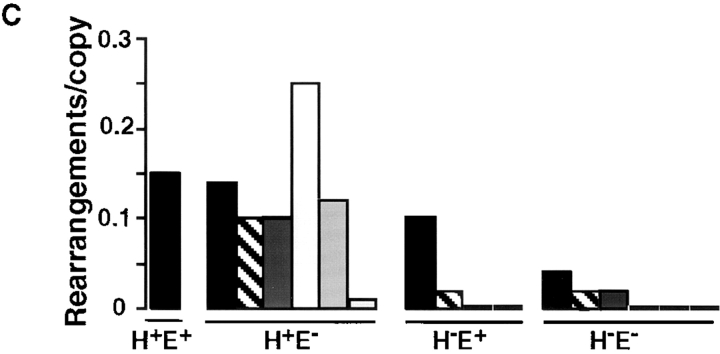
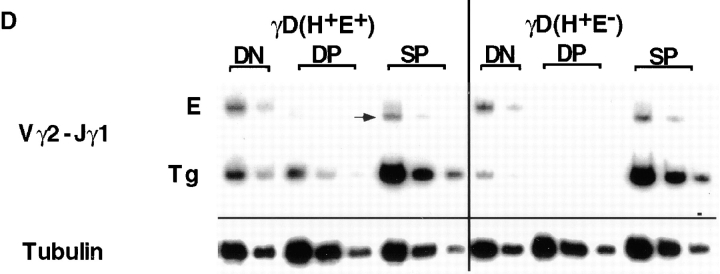
Transgenic expression constructs were employed to identify a cis-acting transcription element in the T cell receptor (TCR)-gamma locus, called HsA, between the Vgamma5 and Vgamma2 genes. In constructs lacking the previously defined enhancer (3'E(Cgamma1)), HsA supports transcription in mature but not immature T cells in a largely position-independent fashion. 3'E(Cgamma1), without HsA, supports transcription in immature and mature T cells but is subject to severe position effects. Together, the two elements support expression in immature and mature T cells in a copy number-dependent, position-independent fashion. Furthermore, HsA was necessary for consistent rearrangement of transgenic recombination substrates. These data suggest that HsA provides chromatin-opening activity and, together with 3'E(Cgamma1), constitutes a T cell-specific locus control region for the TCR-gamma locus.


Figures

Figure 1
Figure 1
DNase I hypersensitive (Hs) sites in the TCR-γ locus. (A) Map of the γ locus. Restriction enzyme sites: R, EcoRI; B, BamHI; and S, SalI. Probes 1 and 2 employed for Southern analysis are indicated, as are the locations of HsA and HsE. (B) Assay for Hs sites upstream of Vγ2. DNA from nuclei treated with twofold increasing amounts of DNase I starting with 0.2 μg was digested with EcoRI. Southern blots were hybridized with probe 1. Unfractionated thymocytes (T), LPS B cell blasts (B), and liver cells (L) were compared. (C) Assay for Hs sites downstream of Cγ1. Assay was performed as for B except that the cells were from a mouse containing 15 copies of a contiguous γ locus transgene (γB), the DNA was digested with BamHI and SalI, and probe 2 was employed. Molecular weight markers (shown as kb) are indicated to the right of each blot.
Figure 2
Figure 2
(A) Schematic depiction of rrV2 constructs. HsA (H) and 3′ECγ1 (E) are indicated. (B) RNase protection assay with RNA from peripheral T cells (top panel) and thymocytes (bottom panel) from each transgenic line. The transgene copy number of each line is indicated above each lane. Lanes containing undigested Vγ2 (V2) and actin (Act) probes, tRNA, and RNA from the DN2.3 cell line are indicated. The identities of the protected transcripts are as follows: 1, transgenic Vγ2; 2, endogenous Vγ2; 3, actin. Endogenous Vγ2 is not expressed in α/β lineage cells, which comprise the majority of peripheral T cells and thymocytes (see text). The double bands in the transgene Vγ2 probably represent spliced and unspliced transcript. Ntg, nontransgenic. (C) Relationship between normalized transcript levels in peripheral T cells and transgene copy numbers. One unit of transcript is defined as the level from one rearranged Vγ2 gene in the DN2.3 cell line. (D) The levels of transcript, corrected for transgene copy number, in thymocytes and peripheral T cells for each transgenic line. The transgene copy number for each line is shown below the bars.
Figure 3
Figure 3
Expression of the transgenes in γ/δ cells. (A) Transgene expression in sorted α/β and γ/δ T cells from one transgenic line representing each construct. The transgene copy number is noted in parentheses. The assay employed three different concentrations of DN2.3 RNA. Identities of the protected bands are listed in the legend for Fig. 2 B. (B) Effect of the transgenes on the percentage of Vγ2+ γ/δ cells in the thymus. Gated CD4CD8 TCR-γ/δ+ adult thymocytes were examined for Vγ2 expression. The transgene copy numbers and RNA expression levels in the thymus are indicated next to each histogram. Vγ2 expression by nontransgenic thymic γ/δ T cells (enriched CD4CD8 cells gated on CD4CD8 TCR-γ/δ+ cells) is shown for comparison.
Figure 4
Figure 4
Developmental activities of HsA and 3′ECγ1. (A) RNase protection assay on RNA from fetal thymocytes collected at the indicated different days of ontogeny (right) and T cell populations representing various developmental stages (left). One line representing each construct is shown, with the transgene copy number noted in parentheses. The populations are: CD4CD8 thymocytes (DN); CD4+CD8+ thymocytes (DP); a mixture of CD4+CD8 and CD8+CD4 thymocytes (SP); and peripheral T cells (PerT). The remaining details of the figure are identical to those in Fig. 2 B. (B) The levels of transcript per transgene copy (same units as Fig. 2) are shown for the populations representing various stages of development and ontogeny. Each point represents an individual line. Varying numbers of lines were tested at each stage/population. Only one HE+ line was tested at E14, 17, and 18, and the analyses of γ/δ versus α/β expression were only performed on one representative line of each type. Four H+E lines were assayed for DN and DP populations.
Figure 5
Figure 5
Role of HsA and 3′ECγ1 in γ gene recombination. (A) Schematic representation of the γD transgene recombination substrates. Hatch marks indicate the internal sites where some genomic DNA was omitted from the constructs. (B) Transgene rearrangement and transcription in enriched populations of DN thymocytes (∼50% pure). Rearrangements of Vγ2 to Jγ1 were assayed by PCR with L2 and J1 primers on genomic DNA from the indicated transgenic lines. PCR products emanating from the transgene (Tg) or endogenous (E) genes were distinguished by digestion with XhoI, a site which had been inserted in the transgene Vγ2 gene. The transgene copy number is indicated above each lane. DNA from 5000 and 1667 cells was amplified for each line. Transcripts of the rearranged genes were assayed in parallel by RT-PCR. (C) Normalized rearrangement levels per transgene copy are shown. Each bar represents an individual line. The values are based on a more complete titration performed separately (see Materials and Methods). (D) Transgene transcription in sorted (99% pure) DN, DP, and SP thymocytes from γD(H+E+) and γD(H+E) lines. A representative RT-PCR assay using Vγ2 rearrangement–specific PCR primers with tubulin PCR as a loading control is shown. PCR was performed on samples serially diluted threefold. Only two lower-sample concentrations are shown for DN populations. Transcripts derived from the transgene and endogenous genes were distinguished as in B. Endogenous Vγ2 genes are not expressed in DP and SP thymocytes. Lower bands below the endogenous transcript (arrow) represent XhoI-digested genomic transgene DNA contaminant. No significant signals were observed in PCR without RT step in each sorted population.
Figure 5
Figure 5
Role of HsA and 3′ECγ1 in γ gene recombination. (A) Schematic representation of the γD transgene recombination substrates. Hatch marks indicate the internal sites where some genomic DNA was omitted from the constructs. (B) Transgene rearrangement and transcription in enriched populations of DN thymocytes (∼50% pure). Rearrangements of Vγ2 to Jγ1 were assayed by PCR with L2 and J1 primers on genomic DNA from the indicated transgenic lines. PCR products emanating from the transgene (Tg) or endogenous (E) genes were distinguished by digestion with XhoI, a site which had been inserted in the transgene Vγ2 gene. The transgene copy number is indicated above each lane. DNA from 5000 and 1667 cells was amplified for each line. Transcripts of the rearranged genes were assayed in parallel by RT-PCR. (C) Normalized rearrangement levels per transgene copy are shown. Each bar represents an individual line. The values are based on a more complete titration performed separately (see Materials and Methods). (D) Transgene transcription in sorted (99% pure) DN, DP, and SP thymocytes from γD(H+E+) and γD(H+E) lines. A representative RT-PCR assay using Vγ2 rearrangement–specific PCR primers with tubulin PCR as a loading control is shown. PCR was performed on samples serially diluted threefold. Only two lower-sample concentrations are shown for DN populations. Transcripts derived from the transgene and endogenous genes were distinguished as in B. Endogenous Vγ2 genes are not expressed in DP and SP thymocytes. Lower bands below the endogenous transcript (arrow) represent XhoI-digested genomic transgene DNA contaminant. No significant signals were observed in PCR without RT step in each sorted population.
Figure 6
Figure 6
Sequence of the PstI/NcoI fragment containing HsA. Consensus transcription factor binding sites are underlined and are numbered as follows: 1, gata 3; 2, gaga; 3, lef/tcf; 4, stat; 5, ebox; 6, myb.

Similar articles

Cited by

References

    1. Sleckman B.P., Gorman J.R., Alt F.W. Accessibility control of antigen-receptor variable-region gene assemblyrole of cis-acting elements. Annu. Rev. Immunol. 1996;14:459–481. - PubMed
    1. Schatz D.G., Oettinger M.A., Schlissel M.S. V(D)J recombinationmolecular biology and regulation. Annu. Rev. Immunol. 1992;10:359–383. - PubMed
    1. Leiden J.M. Transcriptional regulation of T cell receptor genes. Annu. Rev. Immunol. 1993;11:539–570. - PubMed
    1. Bories J.C., Demengeot J., Davidson L., Alt F.W. Gene-targeted deletion and replacement mutations of the T-cell receptor beta-chain enhancerthe role of enhancer elements in controlling V(D)J recombination accessibility. Proc. Natl. Acad. Sci. USA. 1996;93:7871–7876. - PMC - PubMed
    1. Bouvier G., Watrin F., Naspetti M., Verthuy C., Naquet P., Ferrier P. Deletion of the mouse T-cell receptor beta gene enhancer blocks αβ T-cell development. Proc. Natl. Acad. Sci. USA. 1996;93:7877–7881. - PMC - PubMed

Publication types

MeSH terms