. 1999 Sep 6;146(5):905-16.
doi: 10.1083/jcb.146.5.905.

Megabase chromatin domains involved in DNA double-strand breaks in vivo

Affiliations

Megabase chromatin domains involved in DNA double-strand breaks in vivo

E P Rogakou et al. J Cell Biol. .

Abstract

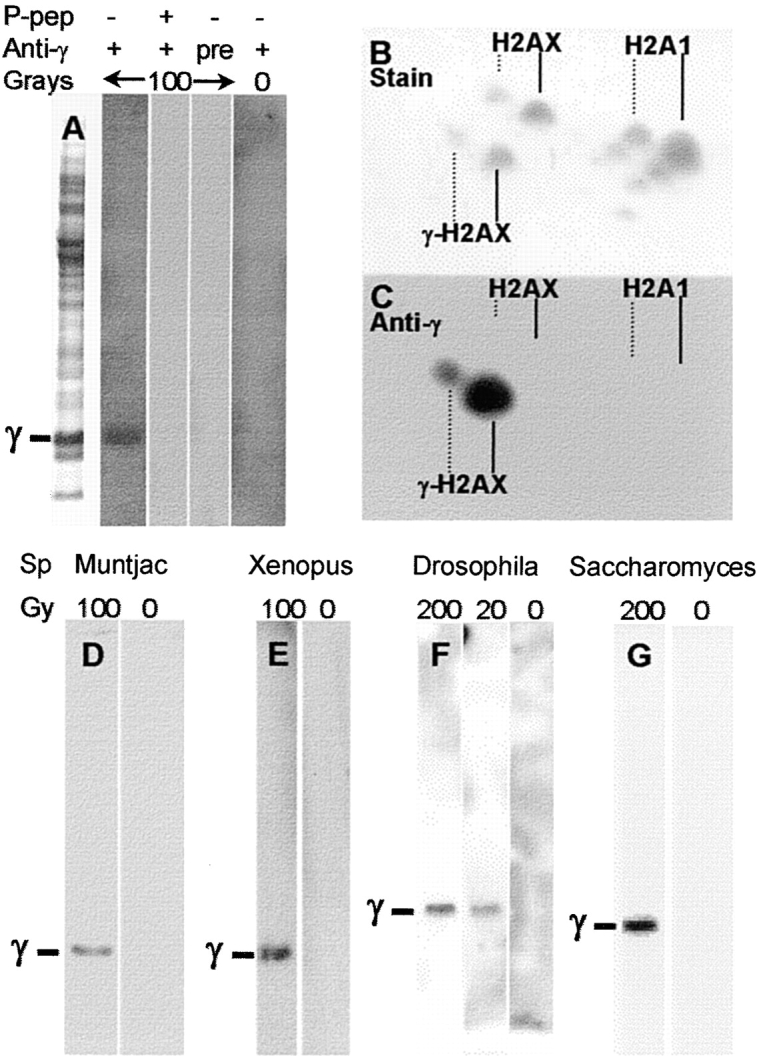
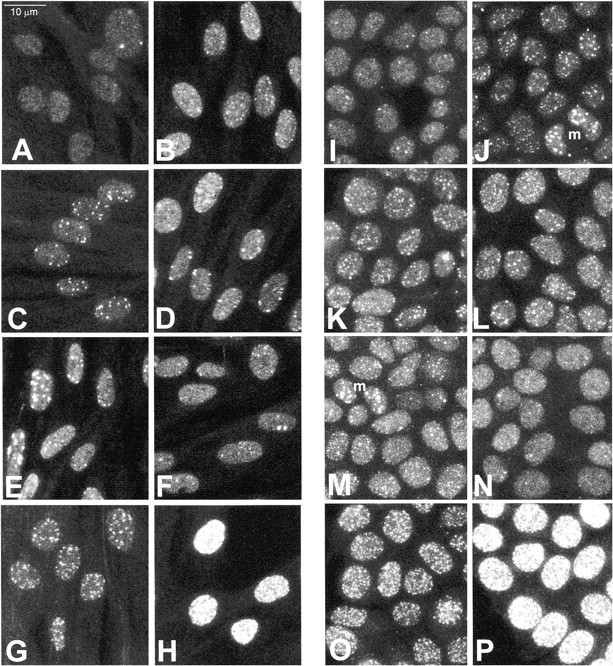
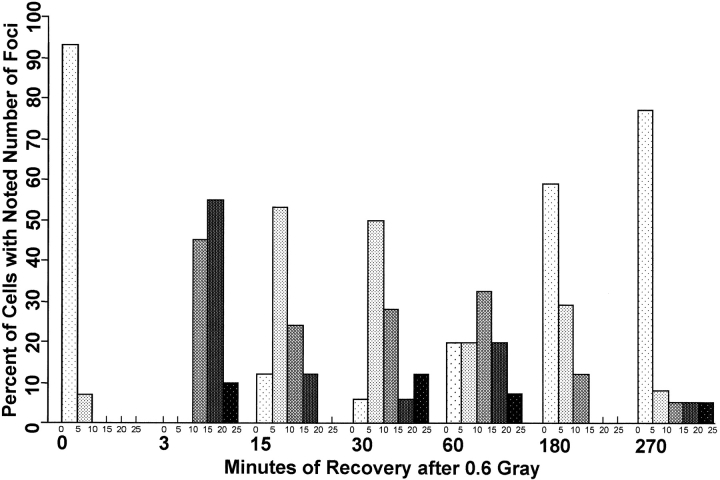
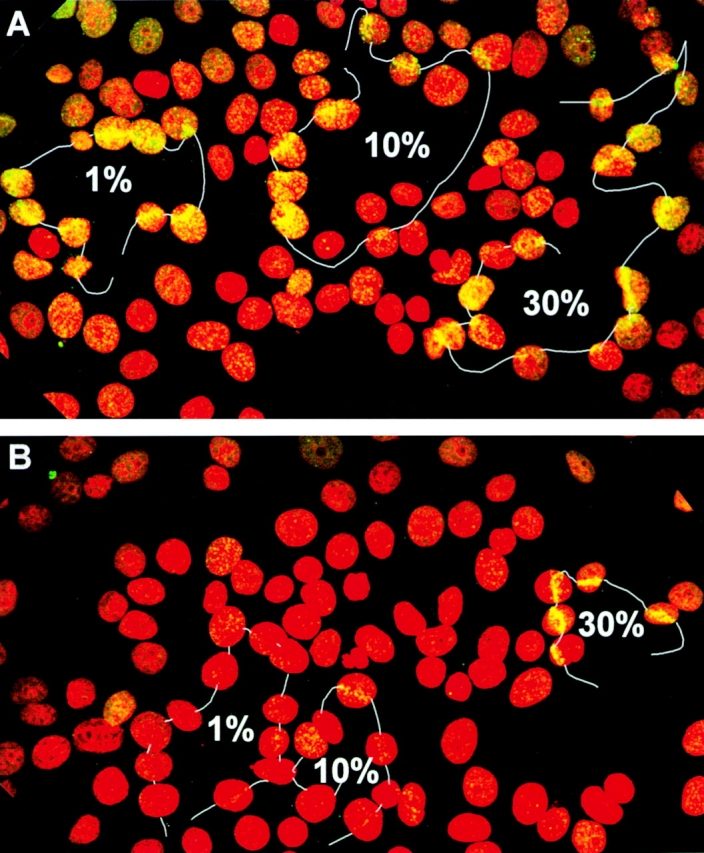
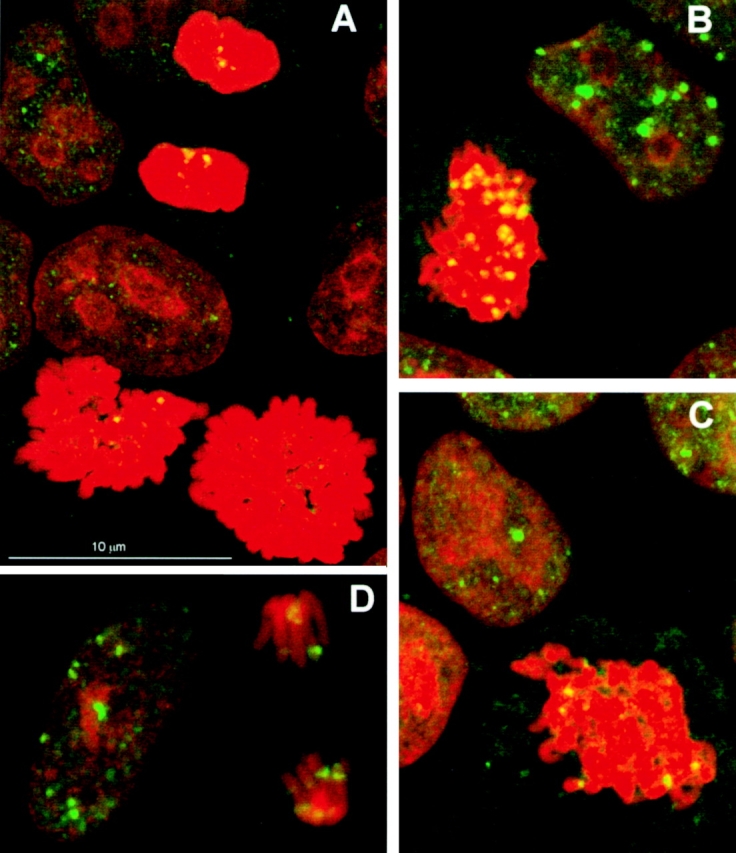
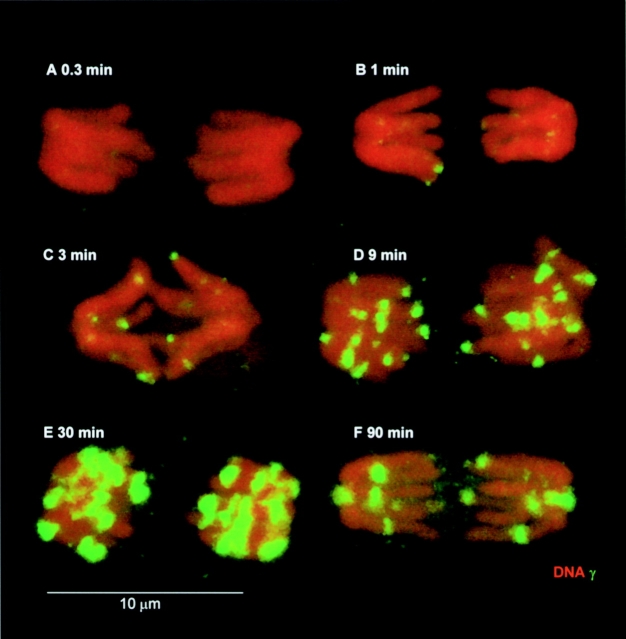
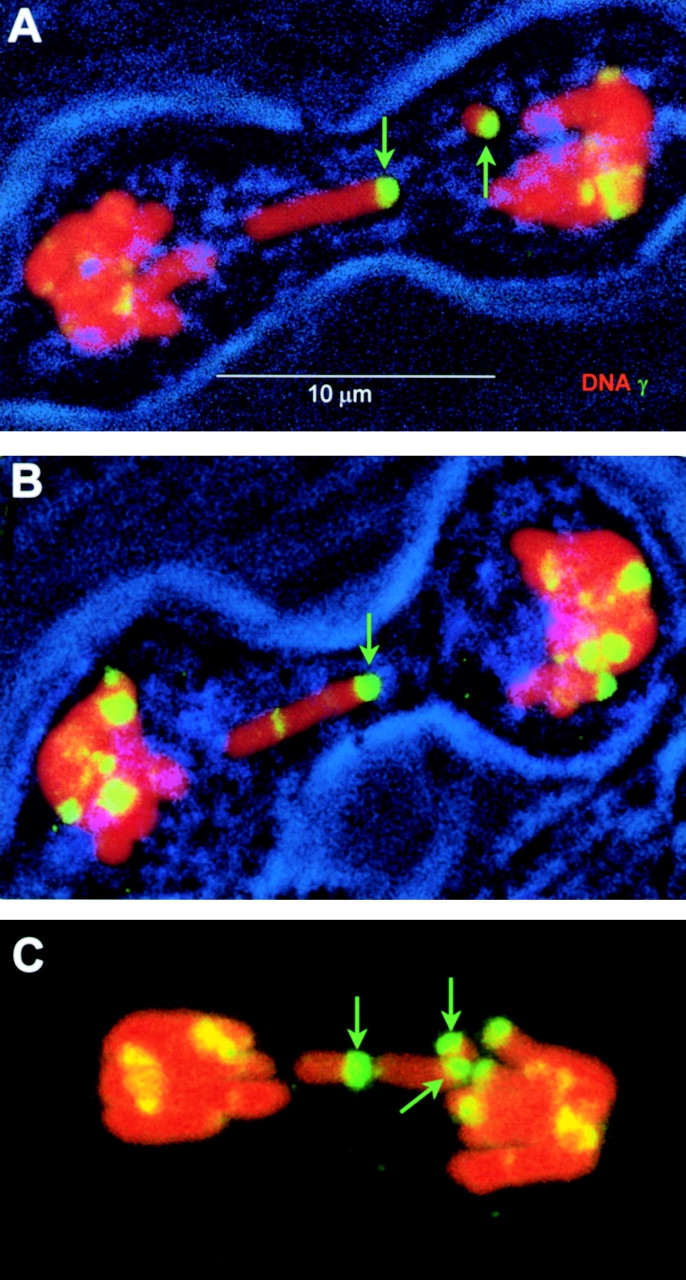
The loss of chromosomal integrity from DNA double-strand breaks introduced into mammalian cells by ionizing radiation results in the specific phosphorylation of histone H2AX on serine residue 139, yielding a specific modified form named gamma-H2AX. An antibody prepared to the unique region of human gamma-H2AX shows that H2AX homologues are phosphorylated not only in irradiated mammalian cells but also in irradiated cells from other species, including Xenopus laevis, Drosophila melanogaster, and Saccharomyces cerevisiae. The antibody reveals that gamma-H2AX appears as discrete nuclear foci within 1 min after exposure of cells to ionizing radiation. The numbers of these foci are comparable to the numbers of induced DNA double-strand breaks. When DNA double-strand breaks are introduced into specific partial nuclear volumes of cells by means of a pulsed microbeam laser, gamma-H2AX foci form at these sites. In mitotic cells from cultures exposed to nonlethal amounts of ionizing radiation, gamma-H2AX foci form band-like structures on chromosome arms and on the end of broken arms. These results offer direct visual confirmation that gamma-H2AX forms en masse at chromosomal sites of DNA double-strand breaks. The results further suggest the possible existence of units of higher order chromatin structure involved in monitoring DNA integrity.


Figures

Figure 1
Figure 1
Immunoblots. After exposure to the indicated amount of ionizing radiation and a 30-min recovery, cells were harvested. Extracts were prepared and analyzed by gel electrophoresis and immunoblotting on polyvinylidene difluoride (PVDF) membranes as described in Materials and Methods. (A) Human MCF7 breast cancer cells. Blots of fractionated total SDS extracts were probed as indicated with anti-γ preimmune serum (pre) or with anti-γ containing 1 μM immunizing peptide (P-pep). The left-most lane shows the protein staining pattern on SDS gels. (B and C) Human SF268 astrocytoma cells. Cultures were irradiated with 100 Gy and analyzed on high-resolution two-dimension acetic acid gels. (D–G) Other eucaryotes. The position of migration of the respective H2AX homologues, H2AX in M. muntjak (D) and X. laevis (E), H2AvD in D. melanogaster (F), and H2A in S. cerevisiae (G) are indicated by γ. Cultures of S. cerevisiae strain BY4733 were irradiated and allowed to recover for 30 min at 30°C. Nuclei were prepared from spheroplasts (Celis 1998), and histones were extracted as described (Ueda and Tanaka 1995). For MCF7, M. muntjak, X. laevis, and S. cerevisiae extracts were prepared with SDS and fractionated on 12% NuPage SDS gels (Novex Novel Technology). For D. melanogaster, extracts were prepared with 0.5 N HCl and fractionated on 12% acetic acid–urea–Triton X-100 gels.
Figure 2
Figure 2
γ-H2AX foci formation in human cells after irradiation (maximum projections showing all recorded foci). IMR90 normal human fibroblasts (A–H) and MCF7 human breast cancer cells (I–P) were exposed to various amounts of ionizing radiation and permitted to recover for various lengths of time. (A and I) Unirradiated control, (B and J) 3 min after 0.6 Gy, (C and K) 15 min after 0.6 Gy, (D and L) 30 min after 0.6 Gy, (E and M) 60 min after 0.6 Gy, (F and N) 180 min after 0.6 Gy, (G and O) 15 min after 2 Gy, (H and P) 15 min after 22 Gy. m indicates mitotic MCF7 cells in J and M. Cells were processed for laser scanning confocal microscopy as described in Materials and Methods.
Figure 3
Figure 3
Numbers of foci in IMR90 cells. Maximum projections of fields of IMR90 cells, similar to those shown in Fig. 2A–F, were analyzed by eye for numbers of foci per nucleus. Nuclei were scored as containing 0–5, 6–10, 11–15, 16–20, or 20–25 foci. All whole nuclei in a field were included, none of which contained >25 foci.
Figure 4
Figure 4
Laser-directed DNA double-strand breaks in MCF7 cells. UVA light was delivered by a 390-nm laser as described in Materials and Methods. The white lines trace the path of the laser as guided with a joystick. The percentages refer to the relative laser energy used in each transit. (A) Cells grown with BrdU. (B) Cells grown without BrdU. In both cases, cells were incubated with Hoechst dye 33258 as described in Materials and Methods.
Figure 5
Figure 5
Interphase and mitotic cells from human MCF7 and M. muntjak cultures. (A–C) MCF7 cells from an unirradiated culture (A) or from cultures exposed to 0.6 Gy and allowed to recover for 15 (B) or 225 (C) min before fixation. (D) M. muntjak cells from a culture exposed to 0.6 Gy and allowed to recover for 15 min before fixation.
Figure 6
Figure 6
γ-H2AX foci developing on M. muntjak mitotic chromosomes (maximum projections). M. muntjak cell cultures were exposed to 0.6 Gy on ice, covered with growth media at 37°C, and allowed to recover for 0.3 (A), 1 (B), 3 (C), 9 (D), 30 (E), and 90 min (F) before fixation. Fields were scanned by eye using phase optics for mitotic cells. Selected cells were optically sectioned at 0.5-μm intervals. The sections were recombined into a maximum projection. The green channel is amplified to the same extent in all samples to visualize the nascent foci at 1 and 3 min; however, this results in some overexposed foci in the 9-, 30-, and 90-min samples.
Figure 7
Figure 7
γ-H2AX foci on defective M. muntjak mitotic figures (maximum projections). Selected mitotic figures were imaged in M. muntjak cell cultures that had been exposed to 0.6 Gy on ice and covered with growth media at 37°C for 90 min before fixation. Green arrows point to ends of isolated chromosome arms with γ-H2AX foci. In A and B, transmitted light was collected to show the outline of the cell membrane.

References

    1. Anderson C.W. Protein kinases and the response to DNA damage. Semin. Cell Biol. 1994;5:427–436. - PubMed
    1. Bai Y., Symington L.S. A RAD52 homolog is required for RAD51-independent mitotic recombination in Saccharomyces cerevisiae . Genes Dev. 1996;10:2025–2037. - PubMed
    1. Cedervall B., Wong R., Albright N., Dynlacht J., Lambin P., Dewey W.C. Methods for the quantification of DNA double-strand breaks determined from the distribution of DNA fragment sizes measured by pulsed-field gel electrophoresis. Radiat. Res. 1995;143:8–16. - PubMed
    1. Celis J.E. Cell Biology. Vol. 2. 2nd ed Academic Press 1998. 533 San Diego; CA: pp
    1. Doida Y., Okada S. Radiation-induced mitotic delay in cultured mammalian cells (L5178Y) Radiat. Res. 1969;38:513–529. - PubMed

MeSH terms