. 1999 Sep 6;146(5):1045-60.
doi: 10.1083/jcb.146.5.1045.

Myosin Va movements in normal and dilute-lethal axons provide support for a dual filament motor complex

Affiliations

Myosin Va movements in normal and dilute-lethal axons provide support for a dual filament motor complex

P C Bridgman. J Cell Biol. .

Abstract

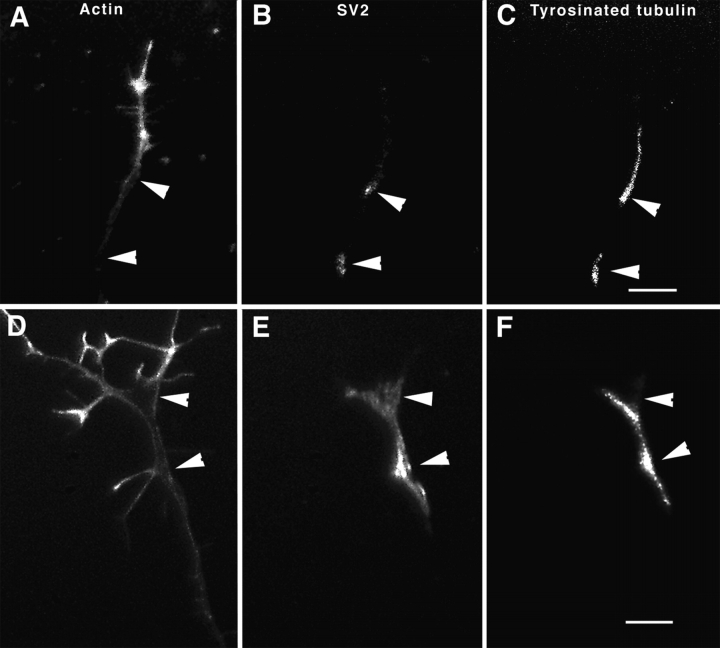
To investigate the role that myosin Va plays in axonal transport of organelles, myosin Va-associated organelle movements were monitored in living neurons using microinjected fluorescently labeled antibodies to myosin Va or expression of a green fluorescent protein-myosin Va tail construct. Myosin Va-associated organelles made rapid bi-directional movements in both normal and dilute-lethal (myosin Va null) neurites. In normal neurons, depolymerization of microtubules by nocodazole slowed, but did not stop movement. In contrast, depolymerization of microtubules in dilute-lethal neurons stopped movement. Myosin Va or synaptic vesicle protein 2 (SV2), which partially colocalizes with myosin Va on organelles, did not accumulate in dilute-lethal neuronal cell bodies because of an anterograde bias associated with organelle transport. However, SV2 showed peripheral accumulations in axon regions of dilute-lethal neurons rich in tyrosinated tubulin. This suggests that myosin Va-associated organelles become stranded in regions rich in dynamic microtubule endings. Consistent with these observations, presynaptic terminals of cerebellar granule cells in dilute-lethal mice showed increased cross-sectional area, and had greater numbers of both synaptic and larger SV2 positive vesicles. Together, these results indicate that myosin Va binds to organelles that are transported in axons along microtubules. This is consistent with both actin- and microtubule-based motors being present on these organelles. Although myosin V activity is not necessary for long-range transport in axons, myosin Va activity is necessary for local movement or processing of organelles in regions, such as presynaptic terminals that lack microtubules.


Figures

Figure 1
Figure 1
Microinjection of myosin Va-Cy3 affinity purified antiserum into normal (A–C) and dilute-lethal (D and E) neurons produces genotype-specific results. (A) High magnification images taken at three different focal planes through a rat neuron injected with a low concentration (<2 mg/ml) of the Cy-3–conjugated antiserum. One bright spot (arrowhead) is visible, but smaller, dimmer spots (arrows) predominate. (B) A lower magnification superimposed image of fluorescence on a phase contrast image of the rat SCG neurons reveals the neurites. (C) Fluorescence image from the same cells in B showing the bright spots (arrowheads) that form upon microinjection of higher concentrations (4 mg/ml) of the antiserum into normal SCG neurons. The upper neuron has brighter diffuse fluorescence and a greater number of spots indicating that more antiserum was injected. Large bright spots may represent aggregates of the small spots induced by antibody cross-linking. Microinjection of antibodies into neurons from heterozygous mice gave the same result. (D) An SCG neuron cultured from a dilute-lethal mouse shows only diffuse fluorescence in the cell body (D) and neurite (E) when microinjected with the Cy-3–conjugated anti–myosin Va antiserum. (E) Two images of a neurite separated by 5 min. Bars: (A) 3 μm; (B and C) 6.5 μm; (D and E) 3 μm.
Figure 2
Figure 2
(A) Time-lapse sequence showing a myosin Va-Cy3 antibody-labeled spot (particle) (arrowhead) making anterograde movements along a rat SCG neurite. Only the small relatively dim spots (visible using a 100× 1.4 NA lens) such as the one shown in this sequence, exhibited rapid movements. Large bright spots seen in cell bodies and proximal neurite segments of neurons injected with larger amounts of antibody never made rapid movements. The interval between images is 6 s. (B) The displacement of individual myosin Va-Cy3 antibody spots (particles) at sequential time points is shown. Positive values indicate movement away from the cell body, negative values indicate movement towards the cell body. Movement is saltatory; pauses and direction reversal can occur for varying periods of time. All examples are from rat SCG neurons. (C) The maximum rates of particle movements from untreated neurons (rat, n = 27; mouse, n = 13) show a wide distribution. Bar, 6.4 μm.
Figure 3
Figure 3
The microinjected myosin Va-Cy3 antibody partially colocalizes with anti–SV2 labeling. (A) From a rat SCG neuron microinjected with a low concentration of the conjugated antiserum. Red is the myosin Va-Cy3 antibody and green is the monoclonal anti–SV2 staining. Yellow indicates that many of the spots (arrowheads) correspond. (B) From a rat cell that was injected with a higher concentration of the myosin Va-Cy3 antibody and then fixed and stained as in A. The large spots are yellow, indicating staining for both myosin Va and SV2 in all visible spots. Experiments done with an unconjugated myosin Va antibody also produced large spots that stained with the SV2 monoclonal antibody (not shown). Bars: (A) 2.5 μm; (B) 3.6 μm.
Figure 4
Figure 4
Photoconversion of the microinjected myosin Va-Cy3–labeled antibody produces dark reaction product spots that are associated with organelles. (A and B) Two examples showing organelles in neurites that extended from different identified rat neuronal cell bodies injected with low concentrations of the antiserum. In both cases, single vesicle profiles are surrounded by dark reaction product (arrows). (B) A thin section from a photoconverted rat neuronal cell body that was injected with a high concentration of the myosin Va-Cy3 antiserum. This cell body contained large bright fluorescent spots before photoconversion. Membrane-bound organelles (arrowheads) surround the dark reaction product. The light spots within the dark area probably represent vesicle profiles. (D) A thin section from a rat neuronal cell body microinjected with a low concentration of antibody. This cell was permeabilized and then incubated with 6 nm gold-conjugated anti–rabbit antibody instead of photoconversion. The small gold particles label two irregular shaped membrane profiles (part of the membrane surface is within the section thickness). Bars: (A–C) 180 nm; (D) 70 nm.
Figure 5
Figure 5
GFP-myosin Va-t fluorescence is correctly targeted in neurons as indicated by colocalization with immunofluorescence staining for myosin Va or SV2. The DIL-2 antibody to myosin Va used for staining was made to amino acids 910–1106 of the myosin Va heavy chain (Wu et al. 1997). This overlapped by two amino acids with the sequence used for the GFP-myosin Va-t fusion protein. To remove a cross-reacting epitope resulting from this overlap, the antiserum was preincubated with a purified GST-myosin Va-t fusion protein coupled to agarose beads. The beads were pelleted by centrifugation and the supernatant used for immunofluorescence staining. (A) GFP-myosin Va-t fluorescence in a neurite from a heterozygous mouse. Arrowheads indicate bright spots of staining along the length of the neurite. (B) Immunofluorescence image of the same area as in A using the preabsorbed DIL-2 antibody. Bright spots of fluorescence (arrowheads) in the neurite correspond with the bright spots seen in A. The neurite lies along the surface of nonneuronal cells that also show bright spots of antibody stain. (C) GFP-myosin Va-t fluorescence in a neurite from a dilute-lethal mouse. (D) Immunofluorescence image of the same area as in C using the preabsorbed DIL-2 antibody. The fluorescence does not colocalize, indicating that the preabsorbed antibody does not cross-react with the GFP-myosin Va-t fusion protein. The few bright spots observed are nonspecific staining. (E) GFP-myosin Va-t fluorescence in a neurite from a heterozygous mouse. (F) Immunofluorescence image of the same area as in E using a mAb to SV2. The brightest spots in the two images show colocalization (arrowheads). Bar, 1.5 μm.
Figure 6
Figure 6
Sequences showing movement of GFP-myosin Va-t in SCG neurons derived from heterozygous (A) and dilute-lethal (B) mice. Stationary and moving spots (arrowheads) are observed in axons from both types of mice (5-s intervals are depicted). A portion of the cell body (arrow) is seen in A. The moving spot in B is elongated or a series of connected spots. (C) Displacement over time of individual GFP-myosin Va-t particles in SCG neurons derived from heterozygous mice. Bidirectional movements are observed. (D) The maximum rate of particle movements observed in neurites from heterozygous mice (n = 23) and rats (n = 7). (E) Displacement over time of individual GFP-myosin Va-t in SCG neurons derived from dilute-lethal mice. Particles in dilute-lethal neurons tended to make larger jumps between time points. (F) The maximum rate of particle movements observed in neurites from dilute-lethal mice. The maximum rates achieved for some particles are greater than those observed in neurons from heterozygous mice. Bar, 5.8 μm.
Figure 7
Figure 7
Rat SCG neurons grown for 3 d in nocodazole (3.3 μg/ml), and then microinjected with anti–myosin Va-Cy3 antibody lack microtubules in cell processes. The distribution of actin (A and D), microinjected myosin Va-Cy3 antibody (B and E), and microtubules (C and F) are shown in two cells (B) used for recording movements of myosin Va-Cy3 antibody spots. The boxed regions in A indicate the areas used for recordings. Although some residual microtubule segments can be observed in the perinuclear region of one noninjected cell (C), they are absent from cell processes that extend peripherally in the injected cells (C and F). D and F are high magnifications of a portion of the cell indicated by the boxed region (right side) in A. Bars: (A–C) 21.5 μm; (B–F) 5 μm.
Figure 8
Figure 8
Quantitative analysis of myosin Va (antibody or GFP-myosin Va-t) movements in neurites treated with nocodazole and latrunculin A. (A) The displacement of individual myosin Va-Cy3 antibody spots (particles) along neurites in rat cells grown for 3 d in nocodazole. The displacement between time points is much less than in untreated cells (see Fig. 2). Pauses and direction reversals appear more numerous than in untreated cells. Positive values indicate movement away from the cell body. (B) The displacement of individual GFP-myosin Va-t spots along neurites in SCG neurons from heterozygous mice grown for 3 d in nocodazole. Movement is saltatory; particles pause and temporarily reverse direction, but progress generally in a single direction. (C) The displacement of individual GFP-myosin Va-t spots in neurons from dilute-lethal mice grown in nocodazole. The particles oscillate around the zero point. (D) The displacement of individual GFP-myosin Va-t spots along neurites in SCG neurons from heterozygous mice grown for 3 d in latrunculin. Movement is greater between time points, is bi-directional, and shows fewer pauses and direction reversals than in nocodazole. (E) The maximum rate of myosin Va-Cy3 antibody spot movement in cells grown for 3 d in nocodazole. The mean maximum rate of movement is significantly slower (t test; P < 0.001) than in untreated cells (see Fig. 2). (F) The maximum rates of GFP-myosin Va-t spot movement in SCG neurons from heterozygous mice grown for 3 d in nocodazole. The mean maximum rate shows a large decrease compared with maximum rates of movement in untreated or latrunculin-treated neurons. (G) The maximum rates of GFP-myosin Va-t spot movement in SCG neurons grown for 3 d in latrunculin. The mean of the maximum rates of GFP-myosin Va-t movements are significantly greater (t test; P < 0.001) in latrunculin compared with nocodazole.
Figure 8
Figure 8
Quantitative analysis of myosin Va (antibody or GFP-myosin Va-t) movements in neurites treated with nocodazole and latrunculin A. (A) The displacement of individual myosin Va-Cy3 antibody spots (particles) along neurites in rat cells grown for 3 d in nocodazole. The displacement between time points is much less than in untreated cells (see Fig. 2). Pauses and direction reversals appear more numerous than in untreated cells. Positive values indicate movement away from the cell body. (B) The displacement of individual GFP-myosin Va-t spots along neurites in SCG neurons from heterozygous mice grown for 3 d in nocodazole. Movement is saltatory; particles pause and temporarily reverse direction, but progress generally in a single direction. (C) The displacement of individual GFP-myosin Va-t spots in neurons from dilute-lethal mice grown in nocodazole. The particles oscillate around the zero point. (D) The displacement of individual GFP-myosin Va-t spots along neurites in SCG neurons from heterozygous mice grown for 3 d in latrunculin. Movement is greater between time points, is bi-directional, and shows fewer pauses and direction reversals than in nocodazole. (E) The maximum rate of myosin Va-Cy3 antibody spot movement in cells grown for 3 d in nocodazole. The mean maximum rate of movement is significantly slower (t test; P < 0.001) than in untreated cells (see Fig. 2). (F) The maximum rates of GFP-myosin Va-t spot movement in SCG neurons from heterozygous mice grown for 3 d in nocodazole. The mean maximum rate shows a large decrease compared with maximum rates of movement in untreated or latrunculin-treated neurons. (G) The maximum rates of GFP-myosin Va-t spot movement in SCG neurons grown for 3 d in latrunculin. The mean of the maximum rates of GFP-myosin Va-t movements are significantly greater (t test; P < 0.001) in latrunculin compared with nocodazole.
Figure 9
Figure 9
SV2 accumulates in axon terminations of heterozygous and dilute-lethal neurons that are rich in tyrosinated tubulin. (A) The actin distribution is depicted in the terminal portion of an axon from a SCG neuron grown from a heterozygous mouse. (B) Wide areas of the axon (arrowheads in A) show increased staining for SV2 (arrowheads). (C) The areas of SV2 accumulation also correspond to the brightest areas (arrowheads) of tyrosinated tubulin staining. (D) The actin distribution is shown for a terminal portion of a SCG neurite grown from a dilute-lethal mouse. (E) Wide areas of axons (arrowheads in D) show increased bright staining for SV2 (arrowheads). (F) The areas of SV2 accumulation seen in E correspond to bright areas of tyrosinated tubulin staining (arrowheads). Bars, 6 μm.
Figure 10
Figure 10
(A) Cross-sectional synaptic profiles of parallel fiber boutons and Purkinje cell dendritic spines from the molecular layer of a P18 heterozygous mouse. Parallel fiber boutons are small and relatively uniform in size. Each bouton contacts a single spine. Purkinje cell spines contain smooth endoplasmic reticulum (arrowheads). (B) Cross-sectional profile of a single large parallel fiber bouton making contact with three (1, 2, and 3) Purkinje cell spines from the molecular layer of a P18 dilute-lethal mouse. Spines lack smooth endoplasmic reticulum. (C) The distribution of SV2 antibody label (12 nm colloidal gold) in a parallel fiber bouton from a heterozygous mouse. Many of the synaptic vesicles (arrowheads) are labeled. Some larger vesicles (arrows) also show label in this oblique section. (D) The distribution of SV2 antibody label in a parallel fiber bouton from a dilute-lethal mouse. Synaptic vesicles (arrowheads) are labeled. (Inset) From another synaptic terminal showing SV2 antibody label on several larger vesicles (arrows). (E) A nonterminal region of a parallel fiber also shows SV2 antibody labeling of large vesicles in the molecular layer of a dilute-lethal mouse. Bars: (A and B) 470 nm; (C–E) 315 nm.

References

    1. Bizario J.C.S., Rosa L.C., Nascimento A.A.C., Larson R.E., Espreafico E.M. Melanosome distribution is affected by expression of chicken myosin-Va constructs in wild type and dilute viral melanoma cells Mol. Biol. Cell. 9 1998. 20a(Abstr.)
    1. Cheney R.E., O'Shea M.K., Heuser J.E., Coelho M.V., Wolenski J.S., Espreafico E.M., Forscher P., Larson R.E., Mooseker M.S. Brain myosin-V is a two-headed unconventional myosin with motor activity. Cell. 1993;75:13–23. - PubMed
    1. Dailey M.E., Bridgman P.C. Vacuole dynamics in growth conescorrelated EM and video observations. J. Neurosci. 1993;13:3375–3393. - PMC - PubMed
    1. Espreafico E.M., Cheney R.E., Matteoli M., Nascimento A.A., De Camilli P.V., Larson R.E., Mooseker M.S. Primary structure and localization of chicken brain myosin-V (p190), an unconventional myosin with calmodulin light chains. J. Cell Biol. 1992;119:1541–1557. - PMC - PubMed
    1. Evans L.L., Bridgman P.C. Particles move along actin filament bundles in nerve growth cones. Proc. Natl. Acad. Sci. USA. 1995;92:10954–10958. - PMC - PubMed

Publication types

MeSH terms