. 1999 Sep 15;19(18):7732-41.
doi: 10.1523/JNEUROSCI.19-18-07732.1999.

Insulin prohormone processing, distribution, and relation to metabolism in Aplysia californica

Affiliations

Insulin prohormone processing, distribution, and relation to metabolism in Aplysia californica

P D Floyd et al. J Neurosci. .

Abstract

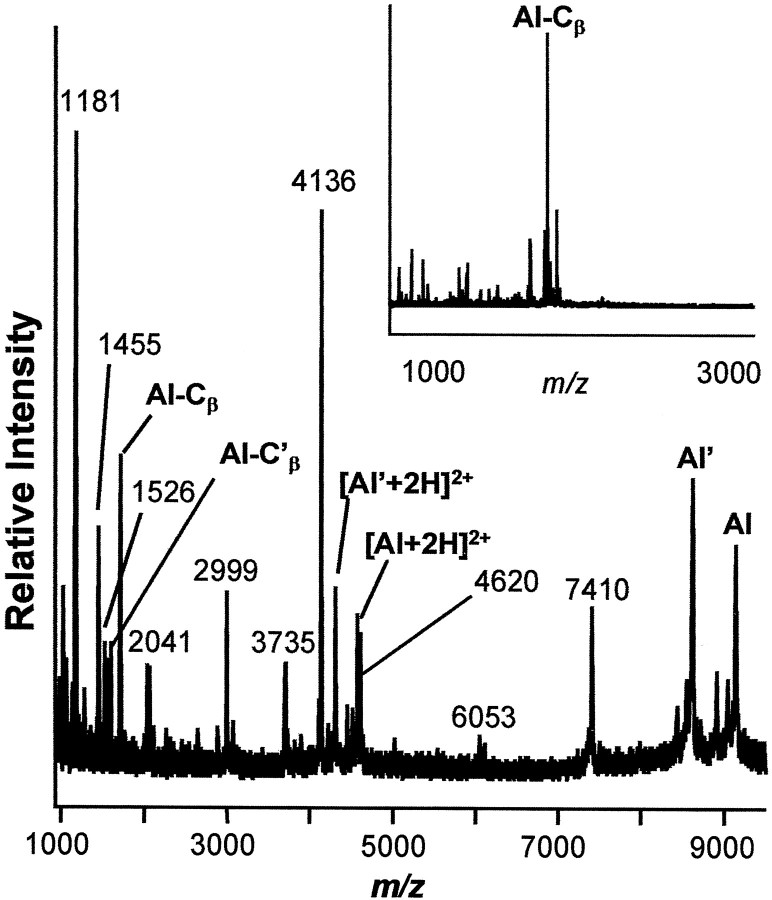
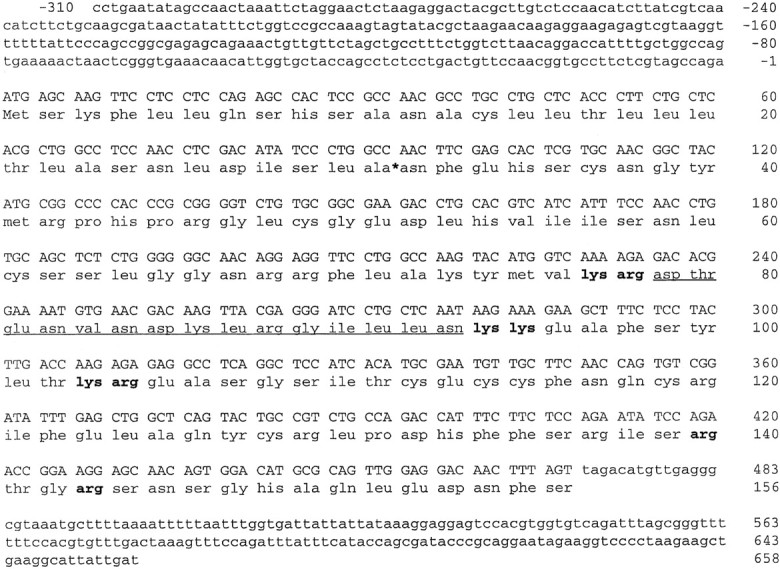
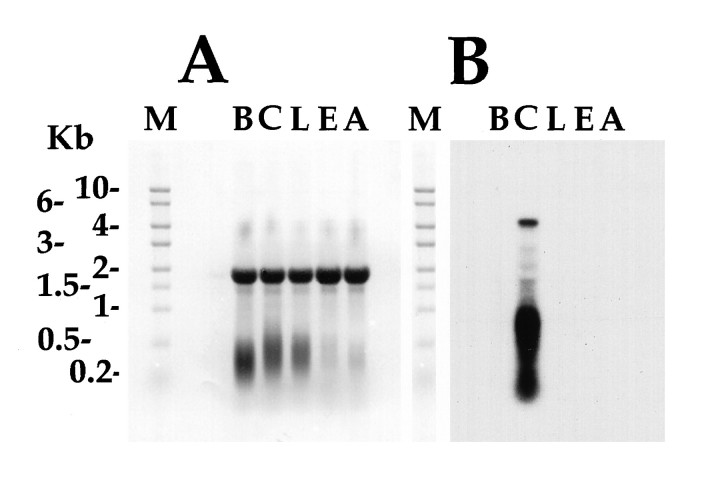
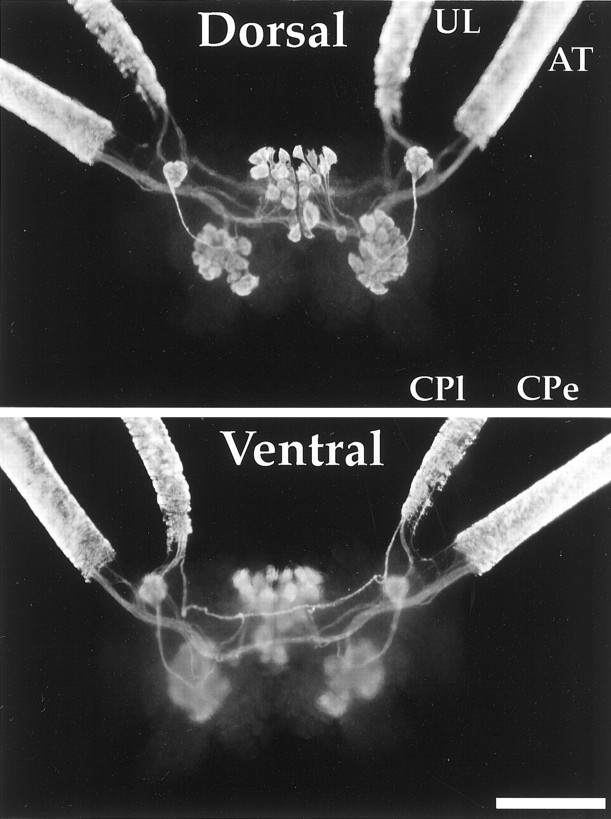
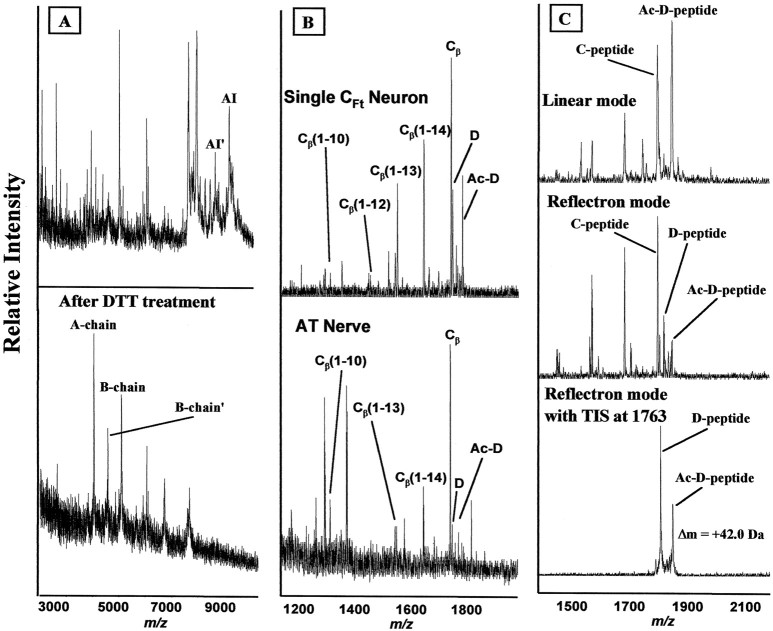
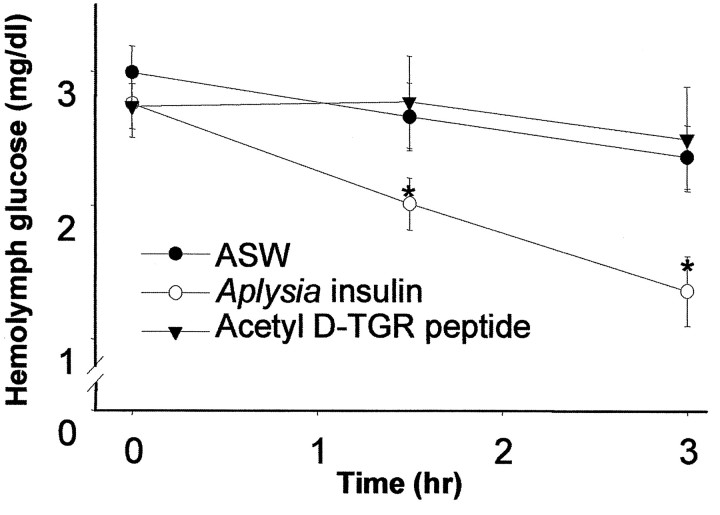
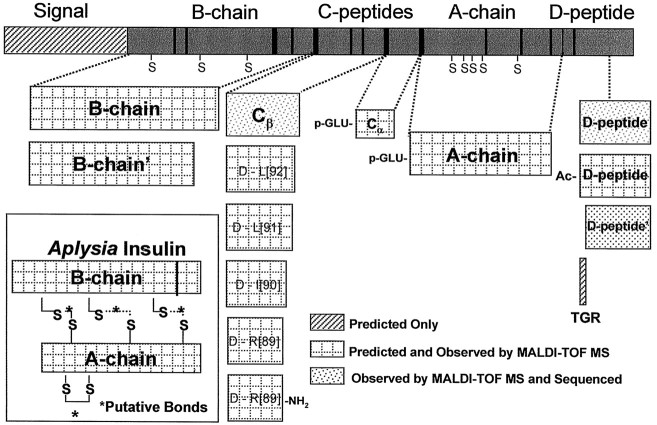
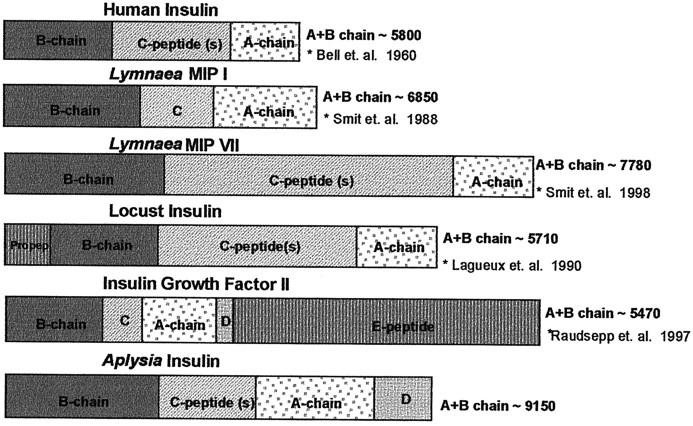
The first Aplysia californica insulin gene is characterized and its proteolytic processing from prohormone to final peptides elucidated using a combination of biochemical and mass spectrometric methods. Aplysia insulin (AI) is one of the largest insulins found, with a molecular weight of 9146 Da, and an extended A chain compared with other invertebrate and vertebrate insulins. The AI prohormone produces a series of C peptides and also a unique N-terminally acetylated D peptide. AI-producing cells are restricted to the central region of the cerebral ganglia mostly within the F and C clusters, and AI is transported to neurohemal release sites located on the upper labial and anterior tentacular nerves. The expression of AI mRNA decreases when the animal is deprived of food, and injections of AI reduce hemolymph glucose levels, suggesting that the function of insulin-regulating metabolism has been conserved.


Figures

Fig. 1.
Fig. 1.
Representative mass spectrum of a top layer neuron from the F cluster in the cerebral ganglion. Peaks generally correspond to [M+H]+, where M is the molecular weight of each peptide. Aplysia insulin (AI), and its shortened form AI′, Cβ, and its truncated form Cβ′, are labeled. Inset, Purified HPLC fraction containing Cβ.
Fig. 2.
Fig. 2.
cDNA and predicted protein sequence of theAplysia insulin prohormone (GenBank accession numberAF160192). The nucleotide sequence of the strand corresponding to the mRNA is shown with 5′ and 3′ untranslated in lowercase letters and the coding region in uppercase letters. Nucleotide sequence in the coding region is grouped by codons with the coded amino acid shown below. Numbering of amino acids and nucleotides is shown at the end of each line with nucleotide numbering negative before the coding sequence and positive after the 5′ untranslated region. Predicted proteolytic processing sites are shown in bold, and the predicted signal sequence proteolytic processing site is shown with an asterisk. The sequence of the biochemically purified and sequenced peptide isunderlined.
Fig. 3.
Fig. 3.
Northern analysis of AI mRNA.A, Methylene blue staining of total RNA isolated from the different ganglia of Aplysia. The equal density of the rRNA band (which runs as a single 18 sec band) demonstrates equal loading of RNA in all lanes. The size and positions of the RNA markers are shown to the left. M, RNA marker lane; B, buccal ganglia; C, cerebral ganglia; L, pleural ganglia; E, pedal ganglia; A, abdominal ganglia. B,Hybridization of the total RNA with probe to the insulin mRNA. The hybridizing RNA is present only in cerebral ganglion total RNA and shows a principal band at ∼4.5 kb. Lower molecular weight (<1 kb) hybridizing RNA in the cerebral ganglia is most likely the result of degradation products of the full-length mRNA.
Fig. 4.
Fig. 4.
Cβ immunoreactivity from whole mounts of the intact cerebral ganglion of a 20 gm juvenile animal, in dorsal (A) and ventral (B) views. Upper labial (UL) nerve, anterior tentacular (AT) nerve, two symmetrical neurons in the region of the optical ganglia, and top layer neurons of the F and C clusters exhibit intense staining. In contrast, the cerebral pleural (CPl) and cerebral pedal (CPe) nerves do not show any staining. Scale bar, 500 μm.
Fig. 5.
Fig. 5.
A, MALDI-MS of a C cluster homogenate before and after DTT treatment, illustrating cleavage of insulin disulfide bonds resulting in the appearance of A (4057 Da) and B (5093 Da) chains. B, Mass spectra of single F cluster neuron (top trace) and AT nerve (bottom trace) showing processing of Cβ with a series of C-terminally truncated forms labeled. C, Confirmation of acetylation of the D peptide. In linear mode, only the acetylated D peptide is observed. When the spectrum is acquired in reflectron mode, both native and acetylated D peptides are seen. The acetylation is further confirmed using the reflectron mode with a timed ion selector (TIS) set at the molecular weight of the acetylated peptide.
Fig. 6.
Fig. 6.
Effect of food deprivation on insulin, cerebral peptide 2 (CP2), myomodulin, and actin mRNA levels. Error bars indicate mean ± SEM of mRNA levels measured from five animals after 0, 1, 2, and 3 weeks of food deprivation.Asterisk denotes statistically significant differences as compared with non-food-deprived controls. CP2 and myomodulin mRNA levels did not change significantly, whereas insulin (p < 0.001) and actin (p < 0.05) mRNA showed significant decreases after 2 and 3 weeks of starvation.
Fig. 7.
Fig. 7.
Effect of AI and the acetyl d-TGR peptide on hemolymph glucose in food-deprived Aplysia. At 1.5 and 3 hr after injection of AI hemolymph, glucose was significantly decreased compared with control injection of ASW. The acetyl d-TGR peptide had no effect on hemolymph glucose. Values are means ± SEM. *p < 0.05 versus ASW control, Tukey’s HSD test.
Fig. 8.
Fig. 8.
Summary of insulin processing based on single-cell MALDI-MS and biochemical characterization. Inset shows AI with the A and B chains connected with putative disulfide bonds.
Fig. 9.
Fig. 9.
Comparison of the AI prohormone structure to those of Lymnaea, human, and locust. As the AI precursor exhibits a D peptide region, it contains characteristics of both insulin and insulin growth factors in addition to being the largest molecular weight insulin reported to date.

References

    1. Abraham GN, Podell DN. Pyroglutamic acid: nonmetabolic formation, function in proteins and peptides, and characteristics of the enzymes effecting its removal. Mol Cell Biochem. 1981;38:181–190. - PubMed
    1. Banting FG, Best CH. The internal secretion of the pancreas. J Lab Clin Med. 1922;7:251–266. - PubMed
    1. Bateman A, Solomon S, Bennett HPJ. Post-translational modification of bovine pro-opiomelanocortin: tyrosine sulfation and pyroglutamate formation, a mass spectrometric study. J Biol Chem. 1990;266:22130–22136. - PubMed
    1. Bell GI, Pictet RL, Rutter WJ, Cordell B, Tischer E, Goodman HM. Sequence of the human insulin gene. Nature. 1960;284:26–32. - PubMed
    1. Boyd FT, Clarke DW, Mather TF, Raizada MK. Insulin receptors and insulin modulation of norepinephrine uptake in neuronal cultures from rat brain. J Biol Chem. 1985;260:15880–15884. - PubMed

Publication types

MeSH terms