. 1999 Sep 15;19(18):7823-33.
doi: 10.1523/JNEUROSCI.19-18-07823.1999.

Tetanic stimulation leads to increased accumulation of Ca(2+)/calmodulin-dependent protein kinase II via dendritic protein synthesis in hippocampal neurons

Affiliations

Tetanic stimulation leads to increased accumulation of Ca(2+)/calmodulin-dependent protein kinase II via dendritic protein synthesis in hippocampal neurons

Y Ouyang et al. J Neurosci. .

Abstract

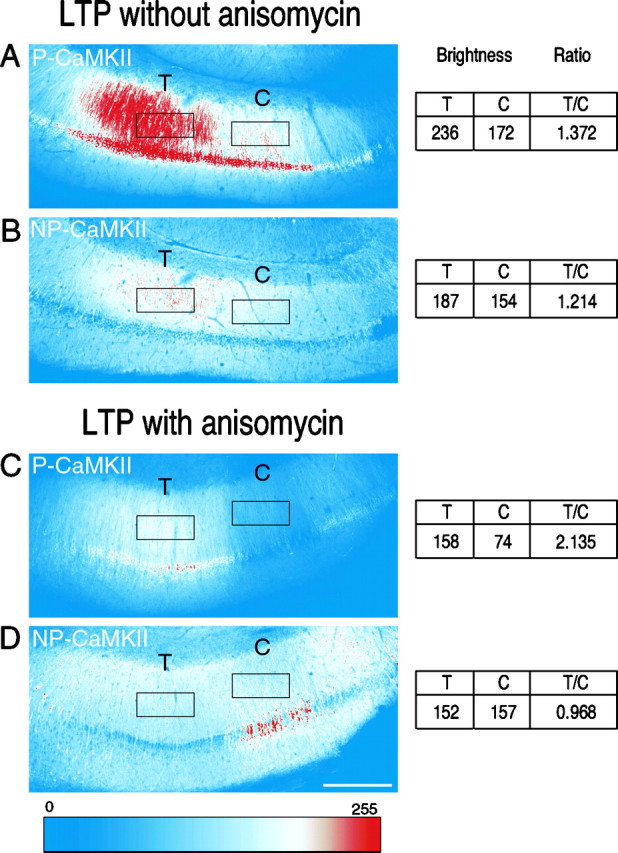
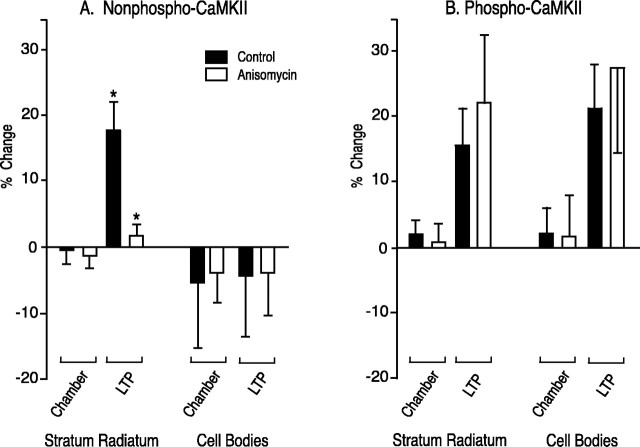
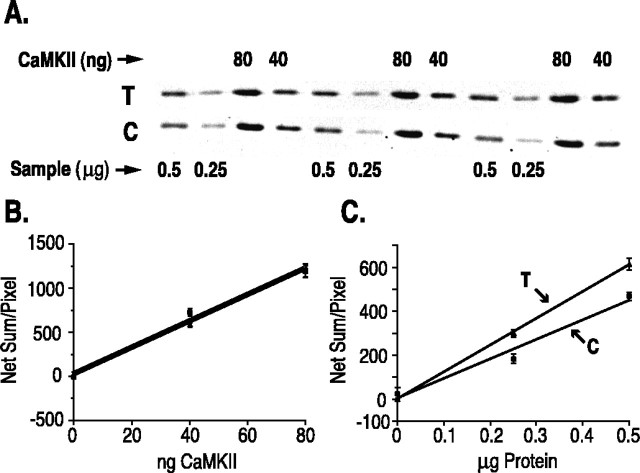
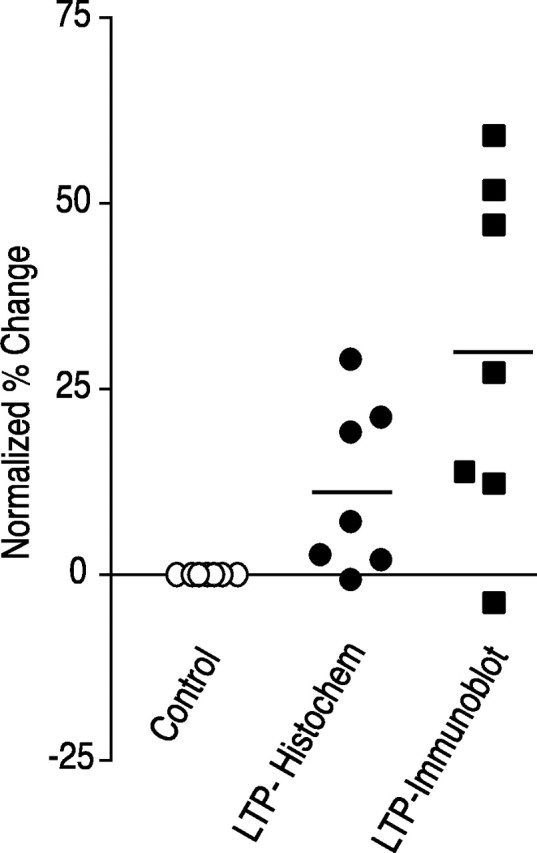
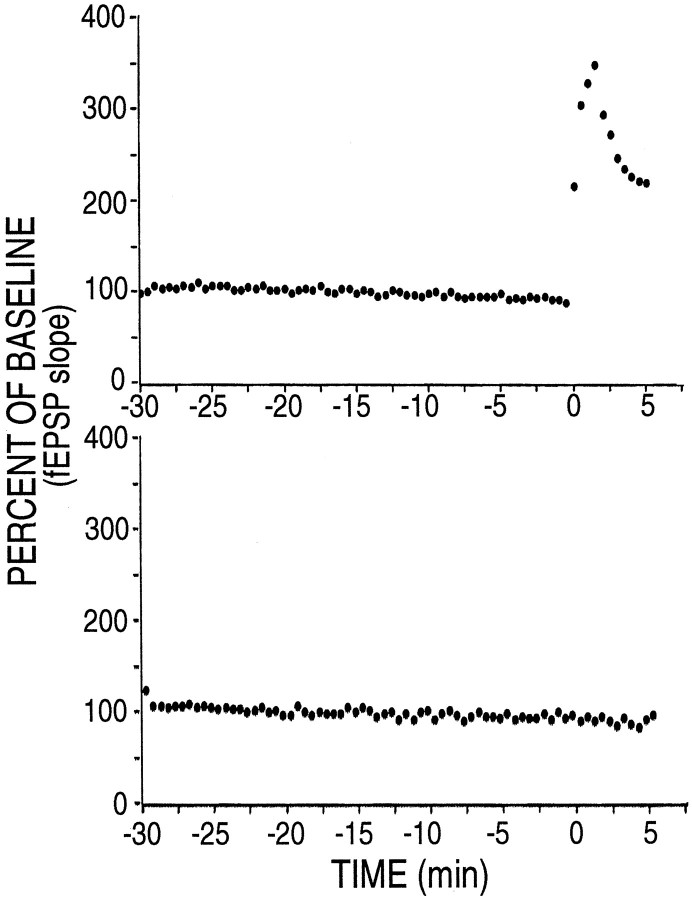
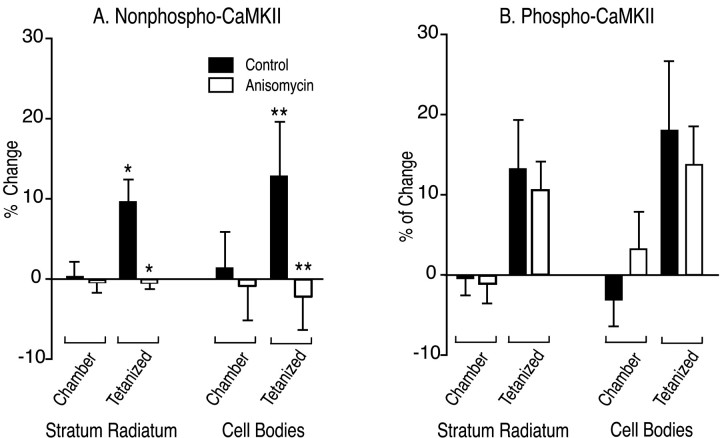
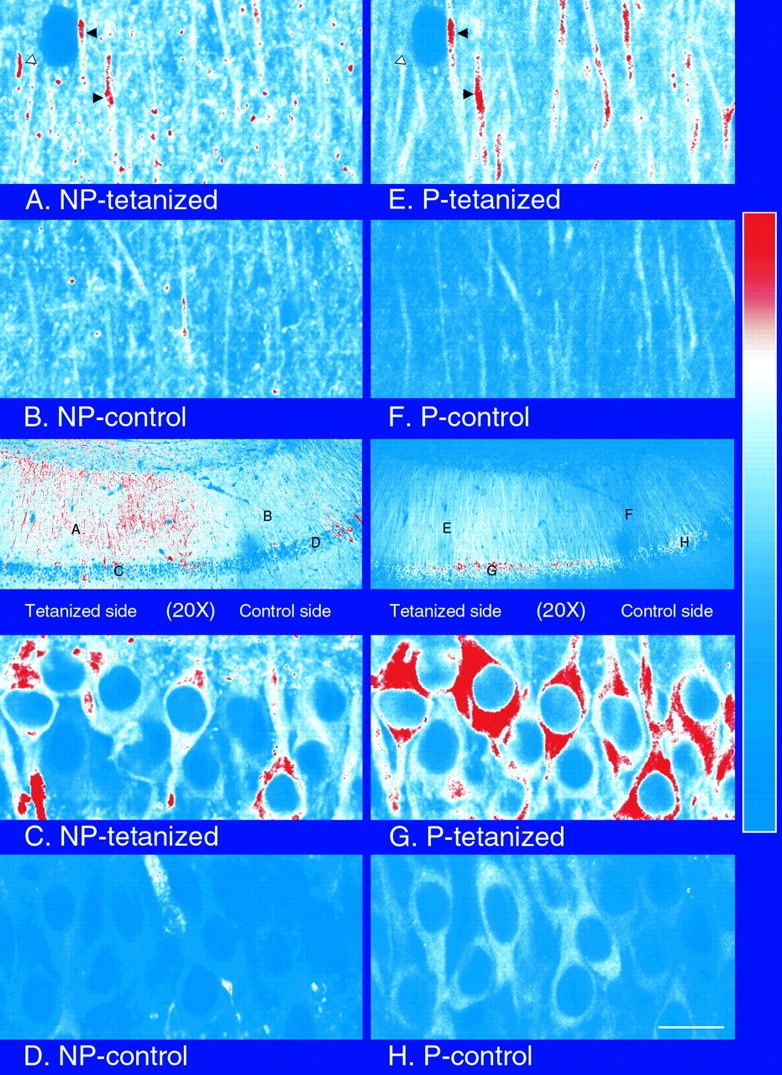
mRNA for the alpha-subunit of CaMKII is abundant in dendrites of neurons in the forebrain (Steward, 1997). Here we show that tetanic stimulation of the Schaffer collateral pathway causes an increase in the concentration of alpha-CaMKII in the dendrites of postsynaptic neurons. The increase is blocked by anisomycin and is detected by both quantitative immunoblot and semiquantitative immunocytochemistry. The increase in dendritic alpha-CaMKII can be measured 100-200 micrometer away from the neuronal cell bodies as early as 5 min after a tetanus. Transport mechanisms for macromolecules from neuronal cell bodies are not fast enough to account for this rapid increase in distal portions of the dendrites. Therefore, we conclude that dendritic protein synthesis must produce a portion of the newly accumulated CaMKII. The increase in concentration of dendritic CaMKII after tetanus, together with the previously demonstrated increase in autophosphorylated CaMKII (Ouyang et al., 1997), will produce a prolonged increase in steady-state kinase activity in the dendrites, potentially influencing mechanisms of synaptic plasticity that are controlled through phosphorylation by CaMKII.


Figures

Fig. 1.
Fig. 1.
Staining for P-CaMKII and NP-CaMKII in area CA1 from representative sections of hippocampal slices fixed 30 min after tetanic stimulation in the absence or presence of anisomycin.A, B, Slices were fixed 30 min after a tetanus was delivered (see Materials and Methods) through a stimulating electrode located in the regions of area CA1 marked T. A stimulating electrode that delivered only test stimulation was located in regions marked c. Sections (50 μm) cut from the slices were double-immunolabeled for P-CaMKII (A) and NP-CaMKII (B) as described in Materials and Methods. Montages of images were converted into color according to the color look-up table depicted at the bottom. The figure shows labeling of one representative section with rectangular ROIs used to compute the ratio of staining between tetanized and control regions (see below and Materials and Methods). Increased labeling for both P-CaMKII (A) and NP-CaMKII (B) is visible in dendrites in stratum radiatum in the region that received tetanic stimulation, decreasing with distance from the tetanizing electrode as described previously (Ouyang et al., 1997). (Compare the region of stratum radiatum labeledT with that labeled c.) The cell bodies of pyramidal neurons in the tetanized region also show stronger labeling for P-CaMKII but not for NP-CaMKII. C,D, Images of a section from a different slice tetanized in the presence of anisomycin. Labeling for P-CaMKII (C) is increased in cell bodies and dendrites in the tetanized region of the section (Compare the region of stratum radiatum labeled T with that labeled c.) In contrast, no increase in labeling for NP-CaMKII (D) is visible in dendrites or cell bodies in the tetanized region compared with those in the control region. Note inD that staining for NP-CaMKII is higher in cell bodies in the control region than in the tetanized region. This pattern was observed occasionally and is the complement of the pattern of staining for P-CaMKII in the same section (C); it likely reflects a reduction in staining for NP-CaMKII in the tetanized cell bodies caused by increased autophosphorylation of CaMKII without a net increase in amount of CaMKII. It is important to note that absolute brightness is not directly comparable between sections, because the microscope contrast settings were chosen in each experiment to fill the 8 bit scale in the brightest of all the sections and then held constant for that experiment. Furthermore, contrast settings are set separately for each fluorophore. Comparison of brightness values is only meaningful between tetanized and control regions of the individual sections averaged over many sections. To make this comparison, ROIs shown as black rectangles were chosen as described in Materials and Methods. The average brightness value in each ROI was recorded as shown to the right. The ratiosT/C were calculated for the three brightest sections from each slice and averaged (Table 1, Fig. 2). Scale bar, 250 μm.
Fig. 2.
Fig. 2.
Quantitative analysis of the ratio of staining in the tetanized region of area CA1 to that in the control region 30 min after tetanic stimulation in the presence and absence of anisomycin. The data from Table 1 are plotted as percent deviation from 1.0 of the ratio of brightness in the tetanized region to brightness in the control region in stratum radiatum and in the cell body layer of area CA1. Ratios from chamber control slices and from slices in which LTP was induced by tetanus in the presence and absence of anisomycin are shown side by side. The data are the average ± SEM of 27 sections from nine chamber control slices and 30 sections from 10 tetanized slices treated in the absence of anisomycin and 14 sections each from seven chamber control slices and seven tetanized slices treated in the presence of anisomycin. A, Percent change in NP-CaMKII between tetanized and control regions of sections. ANOVA followed byt test showed that the change in NP-CaMKII in stratum radiatum after induction of LTP by tetanus is abolished in the presence of anisomycin. B, Percent change in P-CaMKII between tetanized and control regions of sections. No significant differences were observed between brightness values for P-CaMKII in the presence and absence of anisomycin. Solid bars, Control without anisomycin; open bars, with anisomycin; *p < 0.002.
Fig. 3.
Fig. 3.
Quantitative immunoblot of the α-subunit of CaMKII. A, Example of a quantitative immunoblot. Slices were tetanized as described in Materials and Methods and then frozen. Tetanized and control halves of individual slices were dissected and homogenized separately in SDS sample buffer. After determination of the protein concentration of each homogenate, samples of each (0.25 and 0.5 μg) were loaded in triplicate onto SDS-PAGE gels as described in Materials and Methods. CaMKII purified from forebrain (40 and 80 ng of α-subunit) was loaded in triplicate onto adjacent lanes as a standard. Immunoblots were prepared with a fluorescein-conjugated secondary antibody and imaged with a FluorImager. Immunoblot of a homogenate from a tetanized half of stratum radiatum is labeledT. The immunoblot of the corresponding control half of stratum radiatum is labeled C. B, Standard curve of fluorescence intensity plotted against nanograms of purified CaMKII. Quantitative measurements of fluorescence were made as described in Materials and Methods. C, Fluorescence intensity of α-subunit bands from tetanized (T) and control (C) samples shown inA, plotted against a microgram protein sample. The concentration of α-subunit in each homogenate (Fig. 4) was calculated as nanograms per microgram of protein by comparison with the standard curve. Both the standard curve (B) and values for the unknown samples (C) were measured in the linear range of the assay.
Fig. 4.
Fig. 4.
Comparison of increase in CaMKII in tetanized regions of slices measured by immunofluorescence and by quantitative immunoblot. Data from the seven experiments summarized in Table 2 are plotted after normalization to chamber controls. The average percent change measured by immunofluorescent labeling is 11.5 ± 4.0 (p < 0.02 compared with chamber controls). The average percent change measured by quantitative immunoblot is 29.6 ± 8.3 (p < 0.01 compared with chamber controls).
Fig. 5.
Fig. 5.
Electrophysiological recording from a slice that was fixed for immunolabeling 5 min after tetanic stimulation. The stimulation paradigm was as described in Materials and Methods. Baseline EPSPs were monitored for 30 min, and then four trains of tetanic stimulation (100 Hz, 1.0 sec; 30 sec intertetanus interval) were applied to one pathway (top). The slice was fixed 5 min after the first tetanus as described in Materials and Methods. The response of the control pathway (bottom) remained stable.
Fig. 6.
Fig. 6.
Staining for P-CaMKII and NP-CaMKII in area CA1 from representative sections of hippocampal slices fixed 5 min after tetanic stimulation in the absence or presence of anisomycin. Experimental treatment and analyses were exactly as described in Figure1, except that slices were fixed 5 min after a tetanus was delivered through one electrode (see Materials and Methods). A,B, Images of a section tetanized in the absence of anisomycin and fixed 5 min after the tetanus. Increased labeling for P-CaMKII (A) and NP-CaMKII (B) is measured in both cell bodies and in dendrites in stratum radiatum in the region that received tetanic stimulation. C, D, Images of a section from a different slice tetanized in the presence of anisomycin and fixed 5 min after the tetanus. Labeling for P-CaMKII (C) is increased in cell bodies and dendrites in the tetanized region of the section. In contrast, no increase in labeling for NP-CaMKII (D) is measurable in dendrites or cell bodies in the tetanized region compared with those in the control region. Scale bar, 250 μm.
Fig. 7.
Fig. 7.
Quantitative analysis of the ratio of staining in the tetanized region of area CA1 to that in the control region 5 min after tetanic stimulation in the presence and absence of anisomycin. The data from Table 3 are plotted as percent deviation from 1.0 of the ratio of brightness in the tetanized region to brightness in the control region in stratum radiatum and in the cell body layer. Ratios from chamber control slices and from slices fixed 5 min after tetanus in the presence and absence of anisomycin are shown side by side. The data are the average ± SEM of 33 sections each from 11 chamber control slices and 11 tetanized slices treated in the absence of anisomycin and 21 sections each from seven chamber control slices and seven tetanized slices treated in the presence of anisomycin as described in Materials and Methods. A, Percent change in NP-CaMKII between tetanized and control regions of sections. ANOVA followed by t test indicated that staining for NP-CaMKII was significantly brighter in tetanized regions of stratum radiatum and in tetanized cell bodies 5 min after tetanus. The increases in NP-CaMKII 5 min after tetanus in the absence of anisomycin were abolished in the presence of anisomycin. B, Percent change in P-CaMKII between tetanized and control regions of sections. No significant differences were observed between brightness values for P-CaMKII in the presence and absence of anisomycin. Solid bars, Control without anisomycin; open bars, with anisomycin; *p < 0.005; **p < 0.04.
Fig. 8.
Fig. 8.
High-resolution images of staining for P-CaMKII and NP-CaMKII from a section of a slice fixed 5 min after tetanus. Images were recorded with a 40× lens (NA, 1.3) from several areas of a section from a tetanized slice fixed 5 min after tetanus and double-labeled for P- and NP-CaMKII as described in Materials and Methods. Images of the section recorded with a 20× lens are shown for reference (middle); letters(A–H) on the reference images mark the locations where the corresponding 40× images were recorded. Staining for NP-CaMKII is shown on the left; staining for P-CaMKII of the same area is shown on the right. Note that high levels of immunolabeling for P- and NP-CaMKII coincide in some segments of dendrites (A, E, black arrowheads) in the tetanized region but not in others (A, E, white arrowheads). Scale bar: A–H, 15 μm; 20× reference images (middle), 200 μm.

References

    1. Barria A, Muller D, Derkach V, Griffith LC, Soderling TR. Regulatory phosphorylation of AMPA-type glutamate receptors by CaMKII during long term potentiation. Science. 1997;276:2042–2045. - PubMed
    1. Baas PW, Black MM, Banker GA. Changes in microtubule polarity orientation during the development of hippocampal neurons in culture. J Cell Biol. 1989;109:3085–3094. - PMC - PubMed
    1. Bennett MK, Erondu NE, Kennedy MB. Purification and characterization of a calmodulin-dependent protein kinase that is highly concentrated in brain. J Biol Chem. 1983;258:12735–12744. - PubMed
    1. Benson DL, Isackson PJ, Gall CM, Jones EG. Contrasting patterns in the localization of glutamic acid decarboxylase and Ca2+/calmodulin protein kinase gene expression in the rat central nervous system. Neuroscience. 1992;46:825–849. - PubMed
    1. Brady S, Lasek R. Axonal transport: a cell-biological method for studying proteins that associate with the cytoskeleton. In: Wilson L, editor. Methods in cell biology. Academic; New York: 1982. pp. 365–398. - PubMed

Publication types

MeSH terms

Substances

LinkOut - more resources