. 1999 Sep 15;19(18):8036-42.
doi: 10.1523/JNEUROSCI.19-18-08036.1999.

Reconstruction of natural scenes from ensemble responses in the lateral geniculate nucleus

Affiliations

Reconstruction of natural scenes from ensemble responses in the lateral geniculate nucleus

G B Stanley et al. J Neurosci. .

Abstract

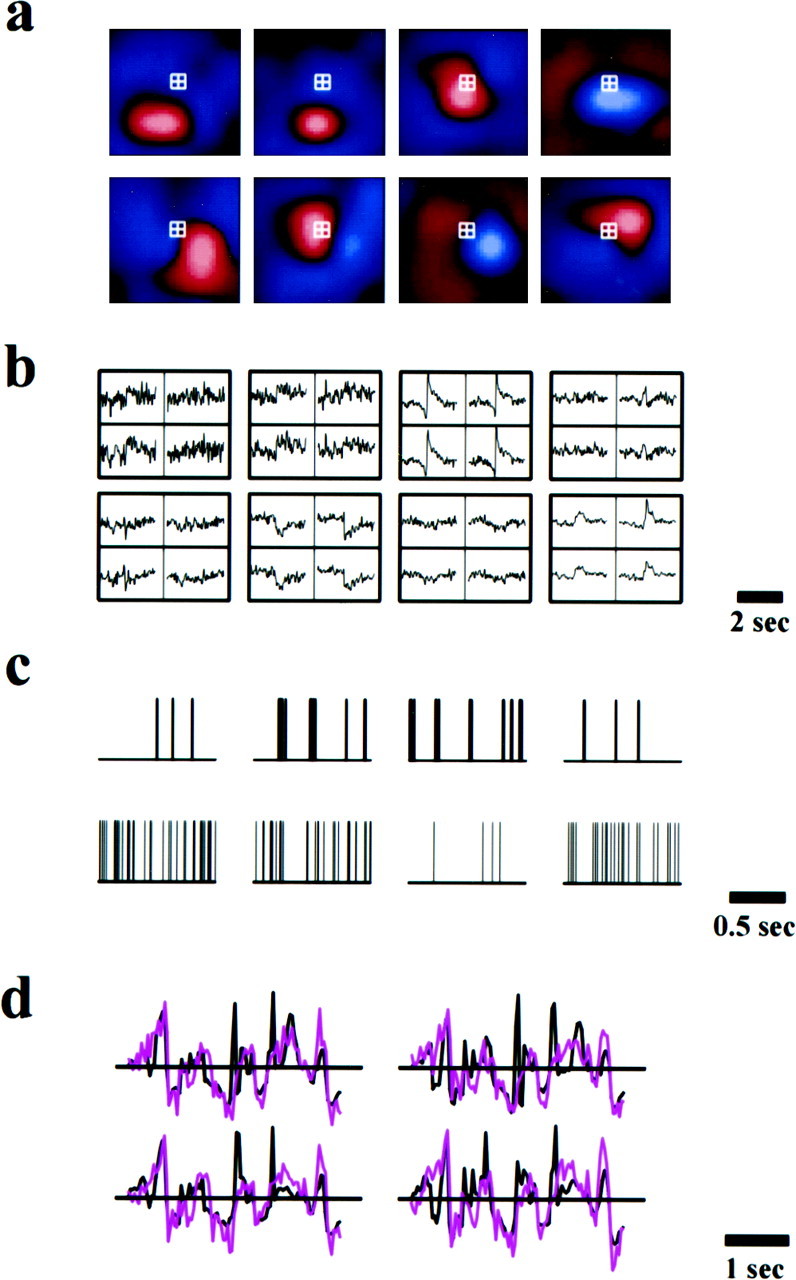
A major challenge in studying sensory processing is to understand the meaning of the neural messages encoded in the spiking activity of neurons. From the recorded responses in a sensory circuit, what information can we extract about the outside world? Here we used a linear decoding technique to reconstruct spatiotemporal visual inputs from ensemble responses in the lateral geniculate nucleus (LGN) of the cat. From the activity of 177 cells, we have reconstructed natural scenes with recognizable moving objects. The quality of reconstruction depends on the number of cells. For each point in space, the quality of reconstruction begins to saturate at six to eight pairs of on and off cells, approaching the estimated coverage factor in the LGN of the cat. Thus, complex visual inputs can be reconstructed with a simple decoding algorithm, and these analyses provide a basis for understanding ensemble coding in the early visual pathway.


Figures

Fig. 1.
Fig. 1.
The procedure for reconstructing visual stimuli from the responses of multiple neurons. a, Receptive fields of eight neurons recorded simultaneously with multielectrodes. These receptive fields were mapped with white-noise stimuli and the reverse correlation method (Sutter, 1987; Reid et al., 1997).Red, On responses. Blue, Off responses. The brightest colors correspond to the strongest responses. The area shown is 3.6 × 3.6°. The responses of these cells were used to reconstruct visual inputs at the four pixels (0.2°/pixel) outlined with the white squares. b, Linear filters for input reconstruction. The eight blocks correspond to the eight cells shown in a. Shown in each block are the four filters from that cell to the four pixels outlined in a. They represent the linear estimates of the input signals at these pixels immediately preceding and following a spike of that cell. Each filter is 3.1-sec-long, with 1.55 sec before and 1.55 sec after the spike. c, Spike trains of the eight neurons in response to movie stimuli. d, The actual (black) and the reconstructed (magenta) movie signals at the four pixels outlined in a. Unlike white noise, natural visual signals exhibit more low-frequency, slow variations than high-frequency, fast variations. Such temporal features are well captured by the reconstruction.
Fig. 2.
Fig. 2.
Reconstruction of natural scenes from the responses of a population of neurons. a, Receptive fields of 177 cells used in the reconstruction. Each receptive field was fitted with a two-dimensional Gaussian function. Each ellipse represents the contour at one SD from the center of the Gaussian fit. Note that the actual receptive fields (including surround) are considerably larger than these ellipses. Red, On center.Blue, Off center. An area of 32 × 32 pixels (0.2°/pixel) where movie signals were reconstructed is outlined inwhite. The grid inside the white square delineates the pixels. b, Comparison between the actual and the reconstructed images in an area of 6.4 × 6.4° (a, white square). Each panel shows four consecutive frames (interframe interval, 31.1 msec) of the actual (top) and the reconstructed (bottom) movies. Top panel, Scenes in the woods, with two trunks of trees as the most prominent objects.Middle panel, Scenes in the woods, with smaller tree branches. Bottom panel, A face at slightly different displacements on the screen. c, Quantitative comparison between the reconstructed and the actual movie signals.Top, Histogram of temporal correlation coefficients between the actual and the reconstructed signals (both as functions of time) at each pixel. The histogram was generated from 1024 (32 × 32) pixels in the white square. Bottom,Histogram of spatial correlation coefficients between the actual and the reconstructed signals (both as functions of spatial position) at each frame. The histogram was generated from 4096 frames (512 frames per movie; 8 movies).
Fig. 3.
Fig. 3.
Evaluation of reconstruction using spectral analyses. Because natural scenes were presented at 32 Hz, these analyses were performed at up to 16 Hz. a, Temporal power spectra of the actual and the reconstructed inputs. Both were averaged from 192 pixels near the center of the screen. For each pixel, the input was reconstructed from the same cells used in Figure 2.b, Comparison between the SER of the reconstruction and the theoretical SER estimated based on the noise in the neuronal responses. Above 3 Hz these two curves are not significantly different. The control SER represents the SER of the reconstruction if there is no causal relationship between the visual stimuli and the neuronal responses. It provides a baseline against which the significance of the real SER can be judged. All three curves were averaged from the same 192 pixels used in a. Vertical linesrepresent SEs. For the control SER, the error bars are smaller than the thickness of the line.
Fig. 4.
Fig. 4.
Dependence of the quality of reconstruction on the number of cells. a, Spatial distribution of cell density and reconstruction quality from the results shown in Figure 2.Ellipses represent centers of receptive fields. On and off cells are represented by the same color. Correlation coefficient between the actual and the reconstructed stimuli (minimum, 0.52; maximum, 0.79) is indicated by the brightness at each pixel. Note that areas covered by higher densities of cells have higher correlation coefficients between the reconstructed and the actual inputs.b, The average temporal correlation coefficient between the actual and the reconstructed natural scenes versus the number of cells used for reconstruction. c, The temporal total SER of the reconstruction (natural scenes) of each pixel versus the number of cells used for that pixel. Total SER was defined as the ratio between the total power of the actual input (integrated between 0.125 and 16 Hz) and the total power of the error. In this analysis, we always used equal numbers of on and off cells. Each point represents the mean from multiple (160–192) pixels near the center of the screen. The vertical lines represent SEs. For bothb and c, we included data from four of the eight different movie clips whose statistics closely matched that for natural scenes described in previous studies (Field, 1987; Dong and Atick, 1995). d,e, The same as b andc, respectively, except the stimulus is spatiotemporal white noise. Here, the white noise was presented at 128 Hz. For calculating the correlation coefficient, both the actual and reconstructed white-noise signals were averaged every four frames to match the sampling rate of natural scenes.

References

    1. Abbott LF. Decoding neuronal firing and modelling neural networks. Q Rev Biophys. 1994;27:291–331. - PubMed
    1. Adrian ED. The impulses produced by sensory nerve endings. Part I. J Physiol (Lond) 1926;61:49–72. - PMC - PubMed
    1. Alonso JM, Usrey WM, Reid RC. Precisely correlated firing in cells of the lateral geniculate nucleus. Nature. 1996;383:815–819. - PubMed
    1. Atick JJ. Could information theory provide an ecological theory of sensory processing? Network: Comput Neural Syst. 1992;3:213–251. - PubMed
    1. Barlow HB. Summation and inhibition in the frog’s retina. J Physiol (Lond) 1953;119:69–88. - PMC - PubMed

Publication types

LinkOut - more resources